
Aurea
D07 · 99-year leasehold
Explore Aurea at Beach Road, with project details, nearby amenities and home layouts.
- Location
- Beach Road
- District
- D07
- Tenure
- 99-year leasehold
- Project units
- 188
Location & nearby places
Approximate location: Approximate project location. Interactive map requires JavaScript and map tiles to load.
Approximate project position, not a surveyed boundary or an entrance. Source
ERA agency project page visible View on map link; not a surveyed parcel, entrance or boundary
- Golden Mile ComplexBus stopsApproximately 80 m straight-line distanceSource
- Opposite Golden Mile ComplexBus stopsApproximately 108 m straight-line distanceSource
- Golden mile food centreFood & drinkApproximately 199 m straight-line distanceSource
- Wedang @ Golden Mile #B1-24Food & drinkApproximately 205 m straight-line distanceSource
- Chung Cheng Prawn Noodles and Chilli MeeFood & drinkApproximately 211 m straight-line distanceSource
- Kampong Glam ParkParksApproximately 287 m straight-line distanceSource
- Opposite Blk 4Bus stopsApproximately 290 m straight-line distanceSource
- St John Singapore Dementia CentreHealthcareApproximately 301 m straight-line distanceSource
- Little Quran KidsPreschoolsApproximately 402 m straight-line distanceSource
- T Medical Clinic (City Gate)HealthcareApproximately 402 m straight-line distanceSource
- Nicoll HighwayRail stationsApproximately 418 m straight-line distanceSource
- North Bridge GardenParksApproximately 418 m straight-line distanceSource
- Sunshine DentalHealthcareApproximately 420 m straight-line distanceSource
- The ConcourseMalls & marketsApproximately 504 m straight-line distanceSource
- LavenderRail stationsApproximately 583 m straight-line distanceSource
- Kallang Riverside Park NorthParksApproximately 598 m straight-line distanceSource
- Shine KoreaSupermarketsApproximately 721 m straight-line distanceSource
- Thai SupermarketSupermarketsApproximately 754 m straight-line distanceSource
- FairPriceSupermarketsApproximately 771 m straight-line distanceSource
- Kallang Wave MallMalls & marketsApproximately 780 m straight-line distanceSource
- Aperia MallMalls & marketsApproximately 827 m straight-line distanceSource
- Sports Hub LibraryLibrariesApproximately 939 m straight-line distanceSource
- StadiumRail stationsApproximately 1,064 m straight-line distanceSource
- Tic-Tac-ToePreschoolsApproximately 1,072 m straight-line distanceSource
- Lotus Bridge International SchoolPreschoolsApproximately 1,163 m straight-line distanceSource
- National LibraryLibrariesApproximately 1,412 m straight-line distanceSource
Nearby places are selected reference points, not a complete amenity directory. Distances are approximate, not walking routes or school-admission eligibility.
Amenity data © OpenStreetMap contributors, available under ODbL 1.0. View source data.
Units & asking prices in snapshot
Source · Checked
Dated snapshot, not a live feed. Availability may have changed since the check above.
| Bedroom / type | Area shown (sq ft) | Units in snapshot | Asking price from | Asking price / sq ft |
|---|---|---|---|---|
| 2 BedroomResidential | 635-710 sqft | — | S$1,771,000 | — |
| 3 BedroomResidential | 1,001 sqft | — | S$2,666,600 | S$2,663.94Calculated from “Price From” ÷ the single area shown |
| 4 BedroomResidential | 1,442 sqft | — | S$4,080,510 | S$2,829.76Calculated from “Price From” ÷ the single area shown |
| 4 Bedroom PremiumResidential | 1,798 sqft | — | S$5,186,105 | S$2,884.37Calculated from “Price From” ÷ the single area shown |
| 5 BedroomResidential | 2,863-3,251 sqft | — | S$9,726,890 | — |
Provider asking prices and availability. “Price From” is a starting price for the displayed type, not an achieved sale price. Availability can change.
Ask FindSpace for the latest details ↗URA recorded transactions
Past sale transactions
Sales history: Oct 2021–Oct 2026
72 records · latest first
| Contract month | Sale type | Floor range | Area (sq ft) / basis | Sale price | Sale PSF | Units |
|---|---|---|---|---|---|---|
| Oct 2026 | New sale | 16-20 | 635.1 · Strata | S$1,863,600 | S$2,934.48 | 1 |
| Jul 2026 | New sale | 21-25 | 710.4 · Strata | S$2,078,000 | S$2,925.04 | 1 |
| Jul 2026 | New sale | 16-20 | 710.4 · Strata | S$2,055,000 | S$2,892.66 | 1 |
| Jul 2026 | New sale | 01-05 | 645.8 · Strata | S$1,805,900 | S$2,796.23 | 1 |
| Jun 2026 | New sale | 11-15 | 645.8 · Strata | S$1,863,600 | S$2,885.57 | 1 |
| May 2026 | New sale | 16-20 | 710.4 · Strata | S$2,060,000 | S$2,899.70 | 1 |
| May 2026 | New sale | 11-15 | 635.1 · Strata | S$1,850,000 | S$2,913.06 | 1 |
| Apr 2026 | New sale | 16-20 | 1,001.0 · Strata | S$3,040,720 | S$3,037.55 | 1 |
| Apr 2026 | New sale | 21-25 | 710.4 · Strata | S$2,101,100 | S$2,957.55 | 1 |
| Apr 2026 | New sale | 11-15 | 635.1 · Strata | S$1,837,268 | S$2,893.01 | 1 |
| Apr 2026 | New sale | 06-10 | 645.8 · Strata | S$1,831,400 | S$2,835.71 | 1 |
| Mar 2026 | New sale | 11-15 | 1,001.0 · Strata | S$2,728,300 | S$2,725.46 | 1 |
| Mar 2026 | New sale | 06-10 | 1,001.0 · Strata | S$2,719,200 | S$2,716.37 | 1 |
| Mar 2026 | New sale | 11-15 | 1,001.0 · Strata | S$2,710,026 | S$2,707.20 | 1 |
| Mar 2026 | New sale | 06-10 | 1,001.0 · Strata | S$2,701,312 | S$2,698.50 | 1 |
| Mar 2026 | New sale | 26-30 | 710.4 · Strata | S$2,095,570 | S$2,949.77 | 1 |
| Mar 2026 | New sale | 11-15 | 710.4 · Strata | S$1,968,000 | S$2,770.20 | 1 |
| Mar 2026 | New sale | 11-15 | 645.8 · Strata | S$1,858,000 | S$2,876.90 | 1 |
| Mar 2026 | New sale | 06-10 | 645.8 · Strata | S$1,852,600 | S$2,868.54 | 1 |
| Feb 2026 | New sale | 11-15 | 1,001.0 · Strata | S$2,719,000 | S$2,716.17 | 1 |
Sale prices use URA’s recorded price. PSF is calculated from that price and the reported strata or land area for single-unit sales. Multi-unit transactions show the total price and unit count. Recent records may be added or revised.
URA private residential property data. Calculations by FindSpace. Source · Singapore Open Data Licence
Floorplans & site plans
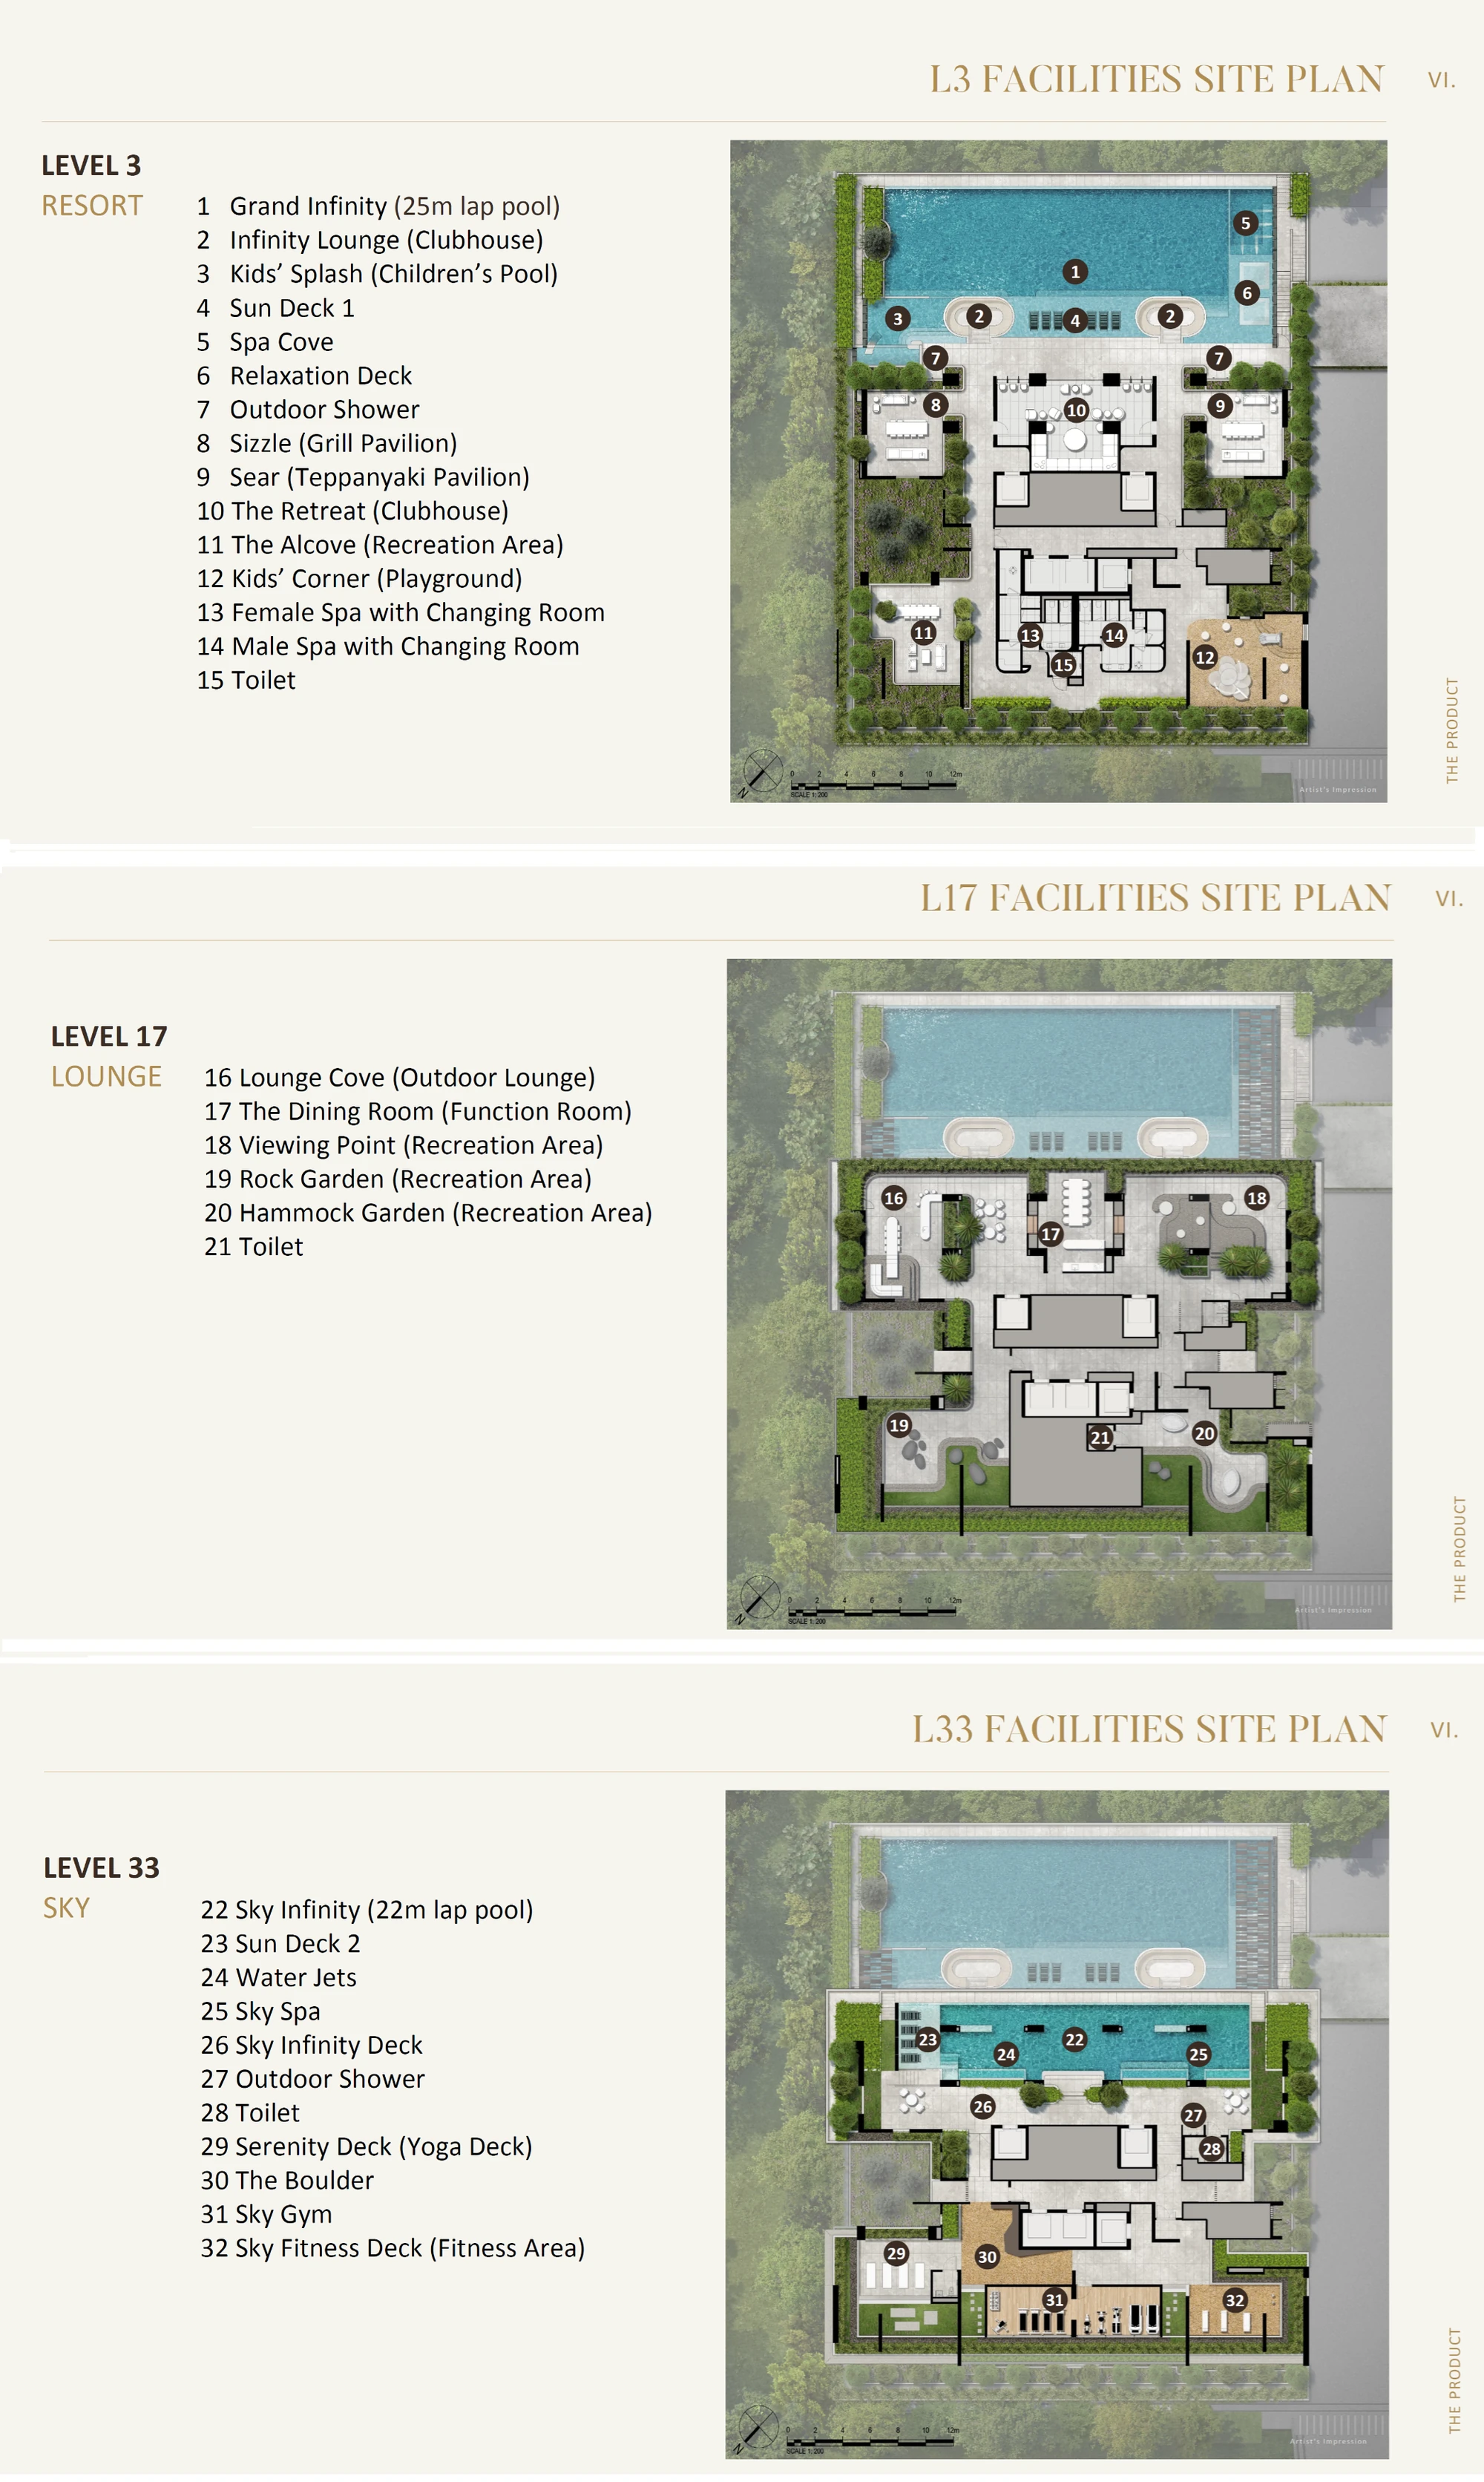
Site plan
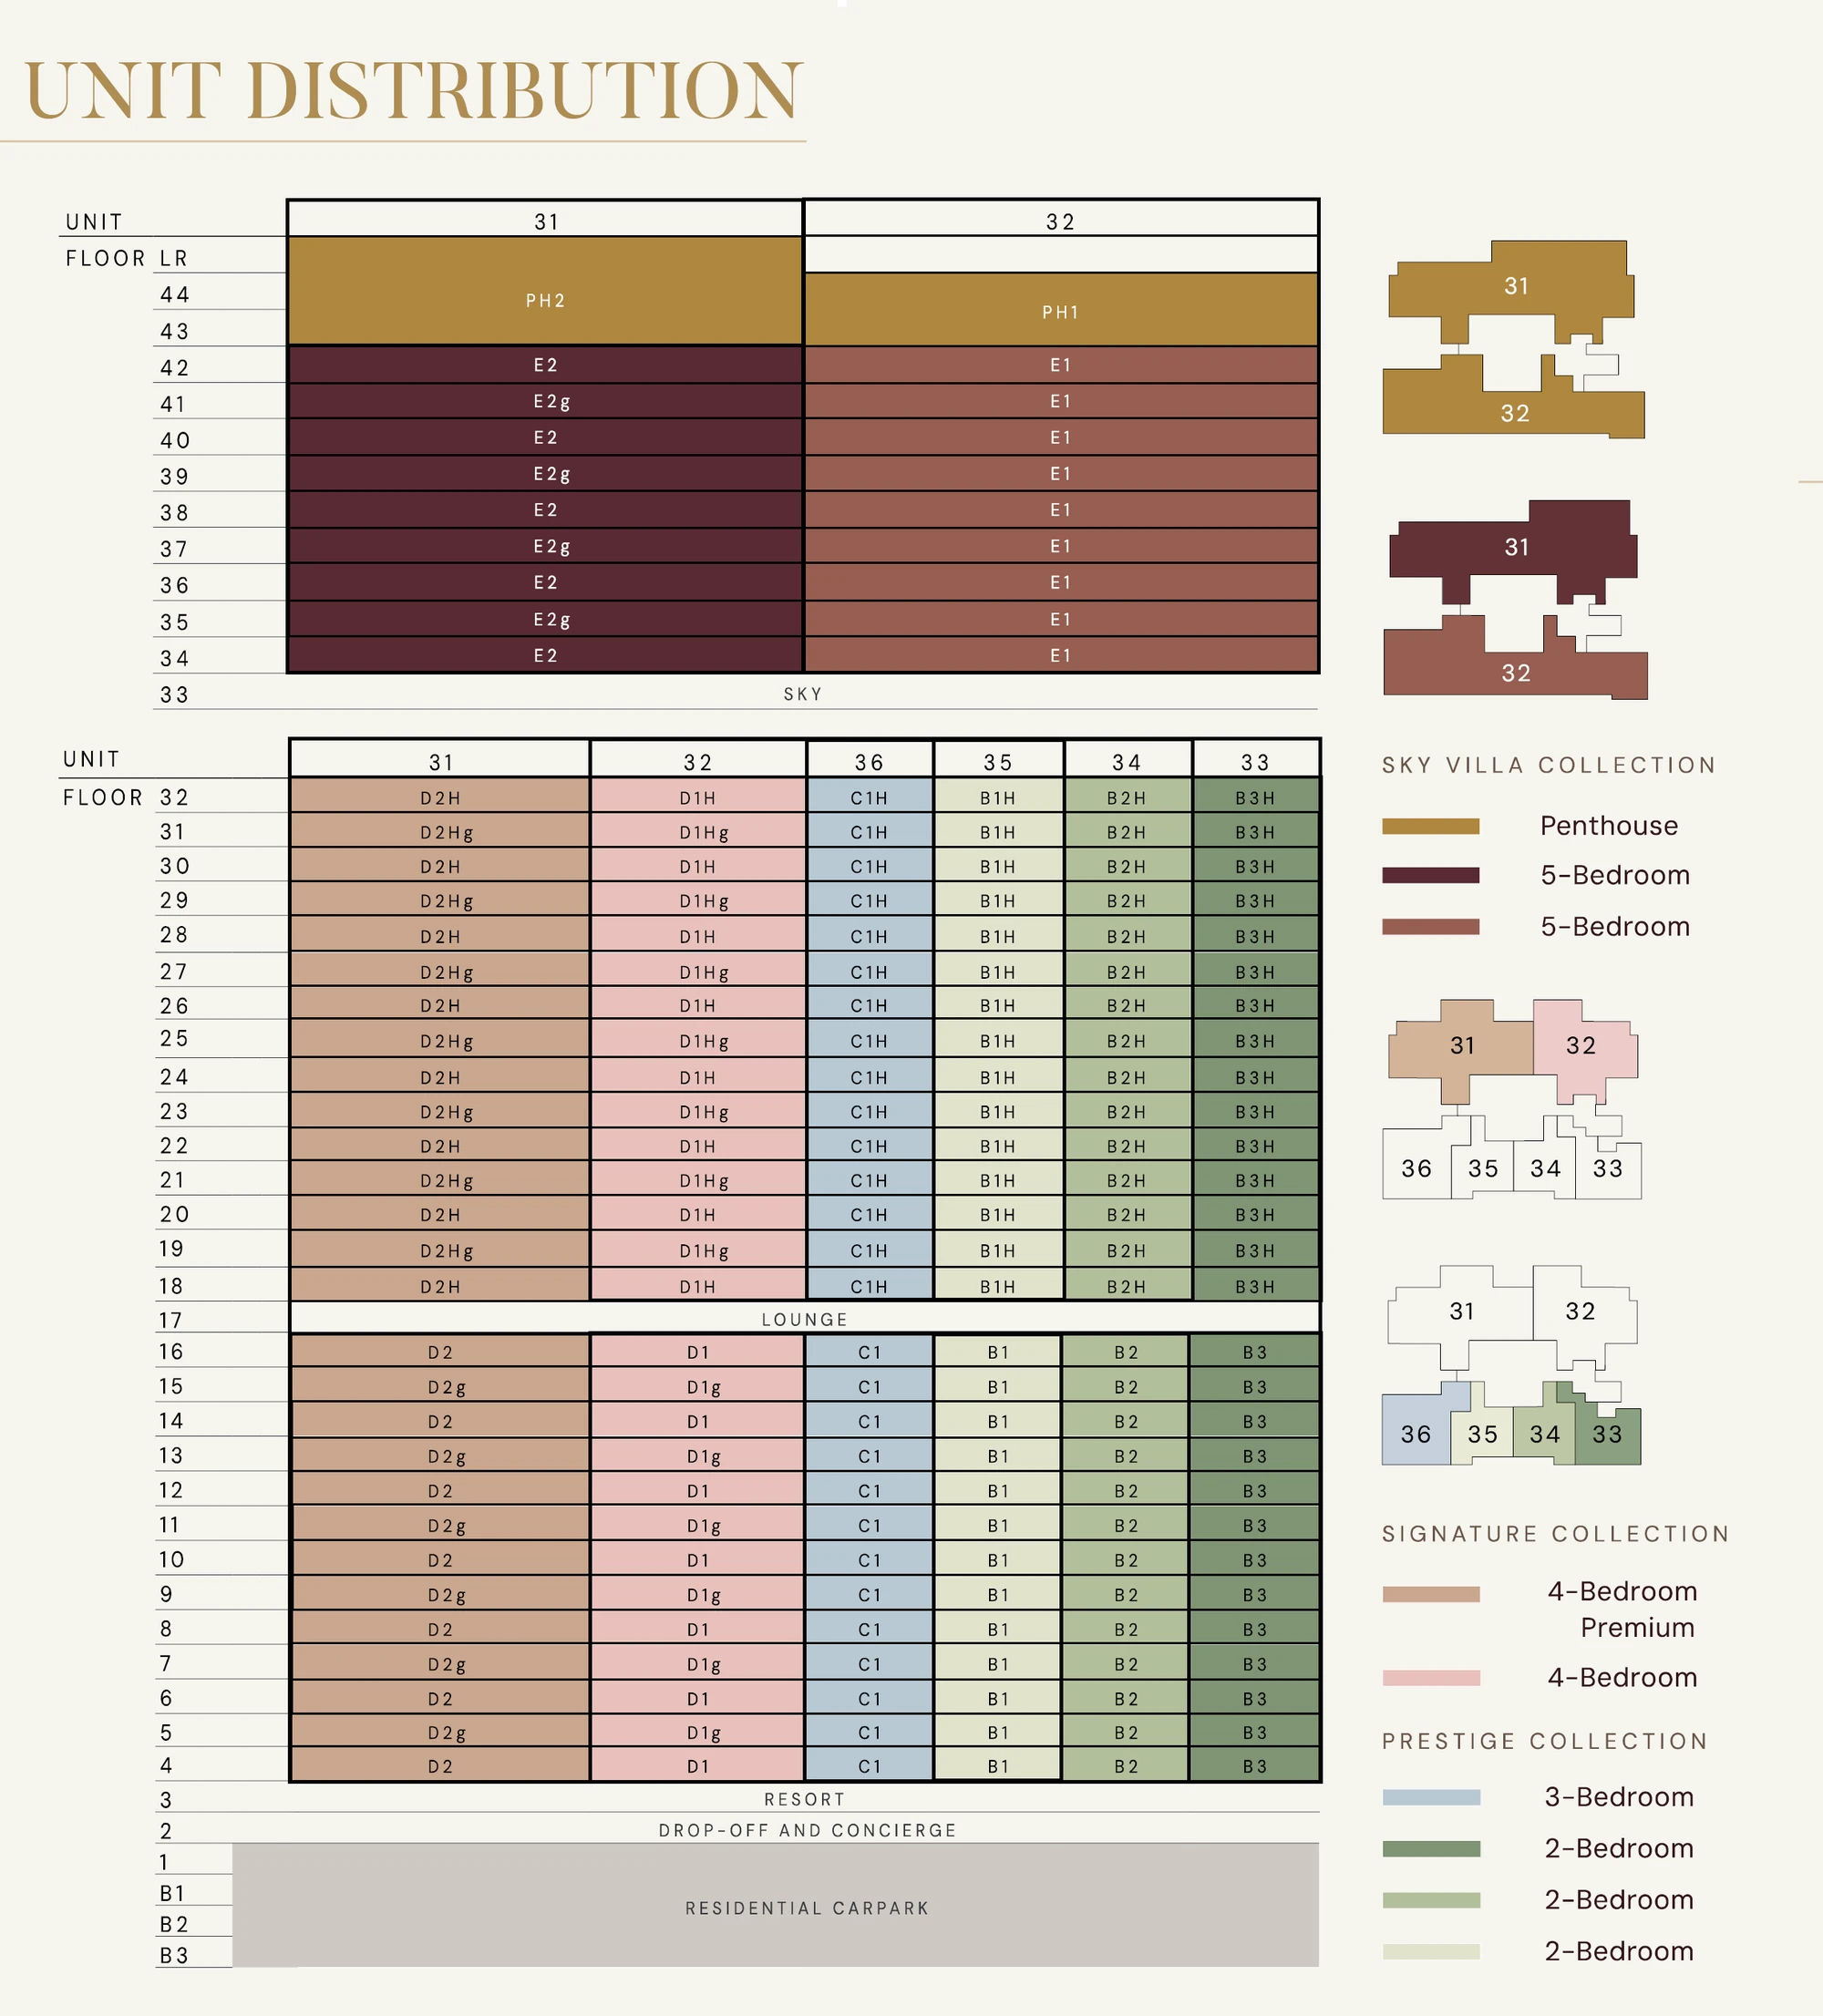
Elevation & stack plans
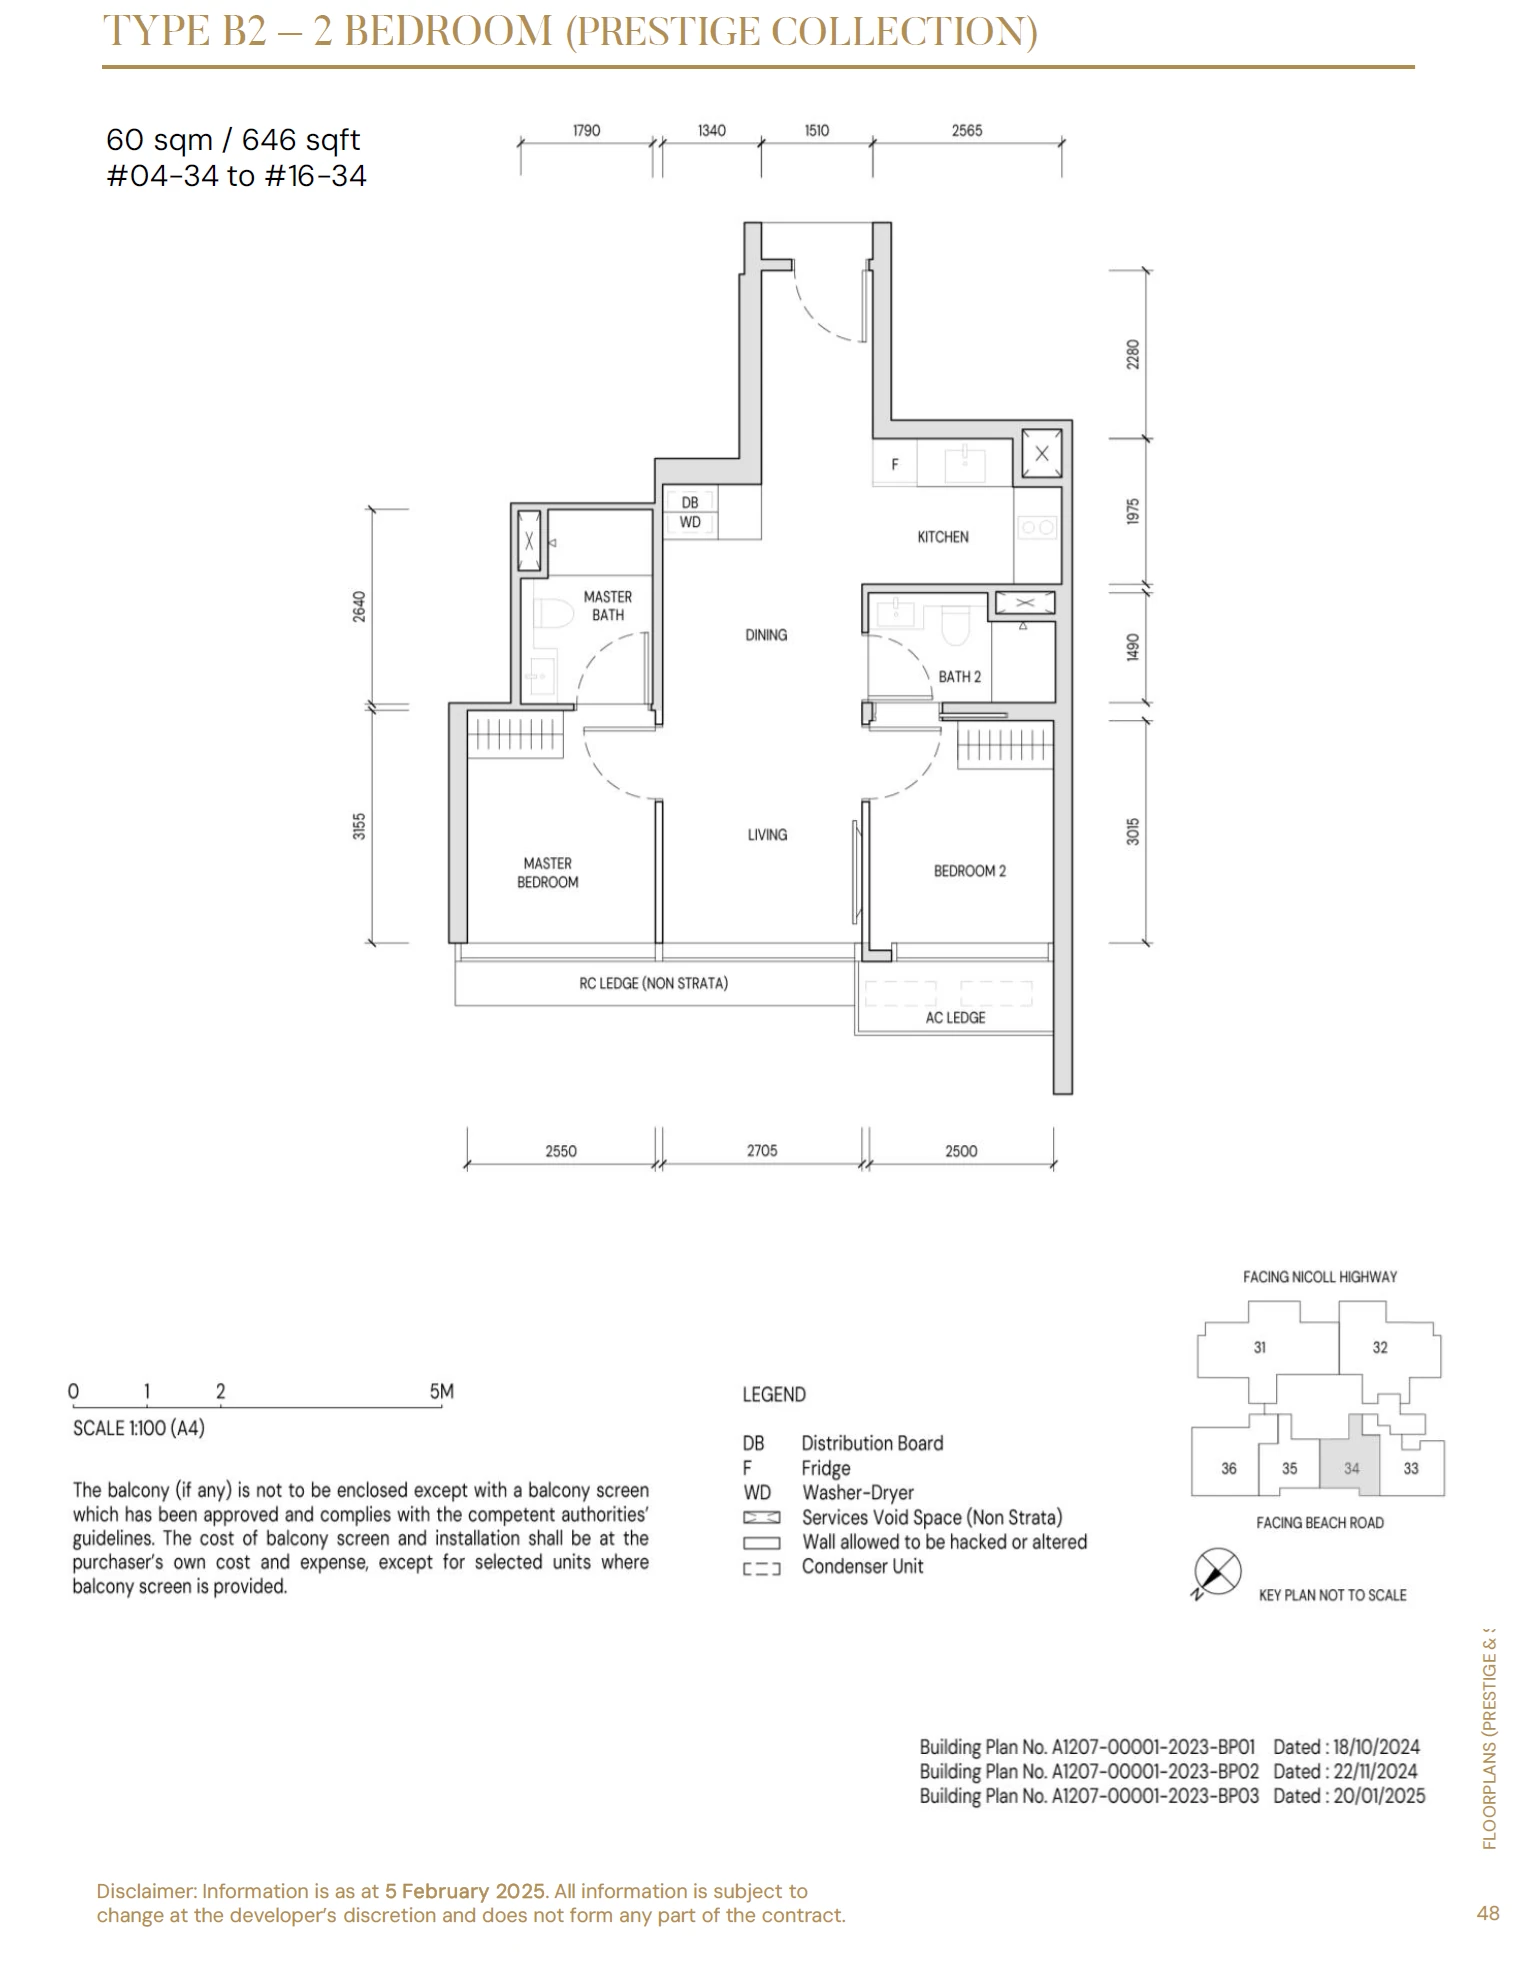
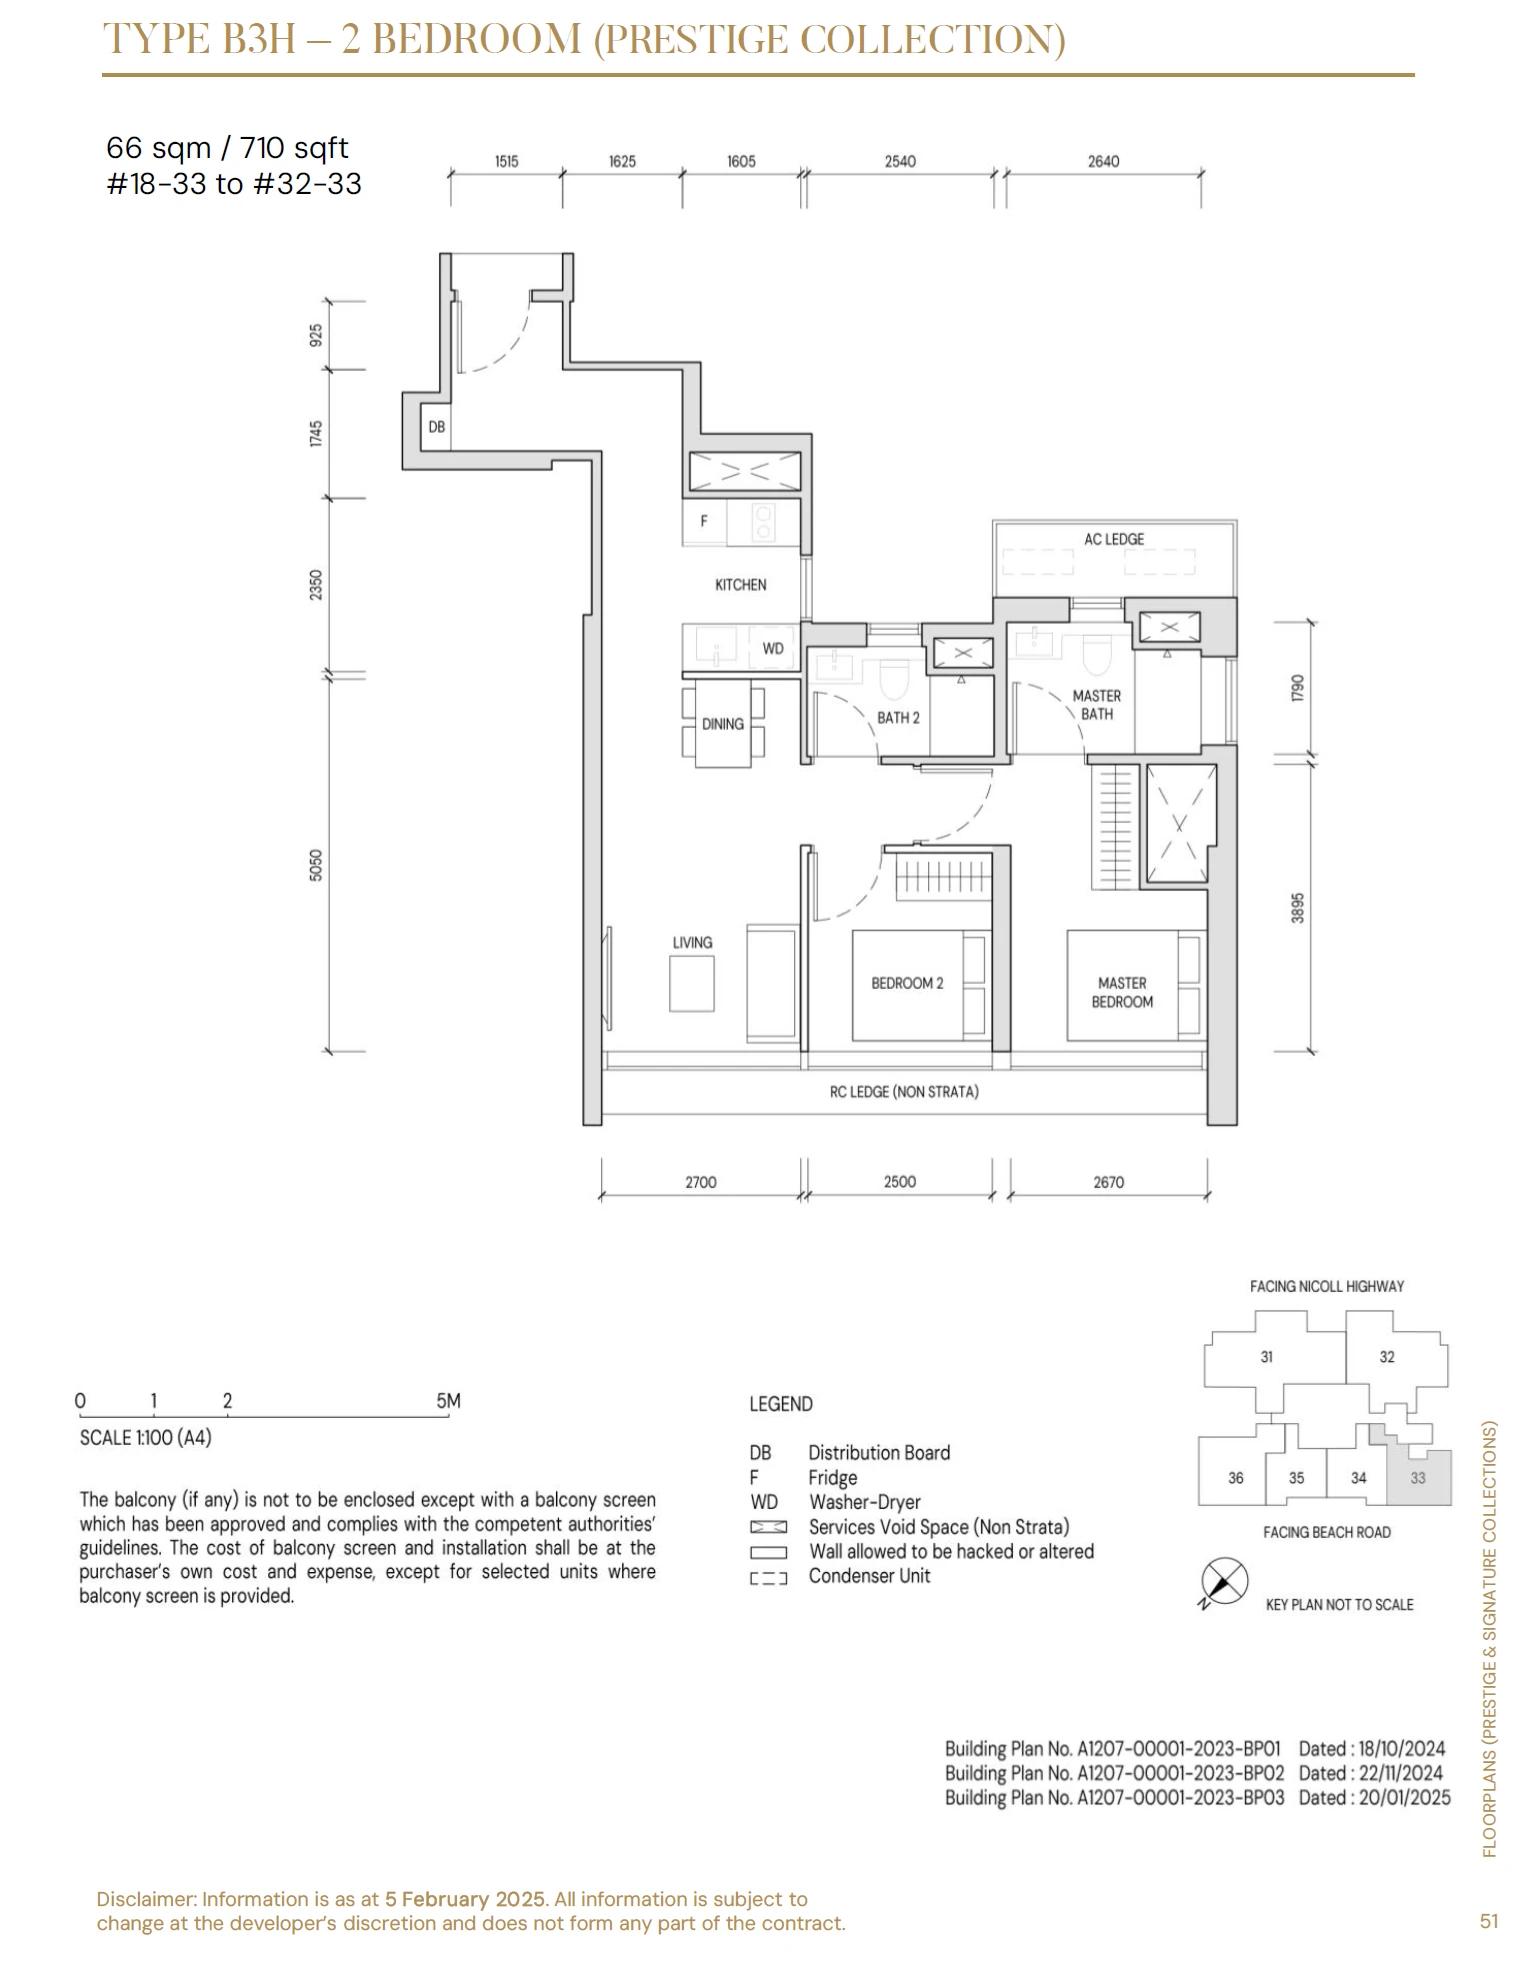
Floorplans
Select a plan to view it at full size.
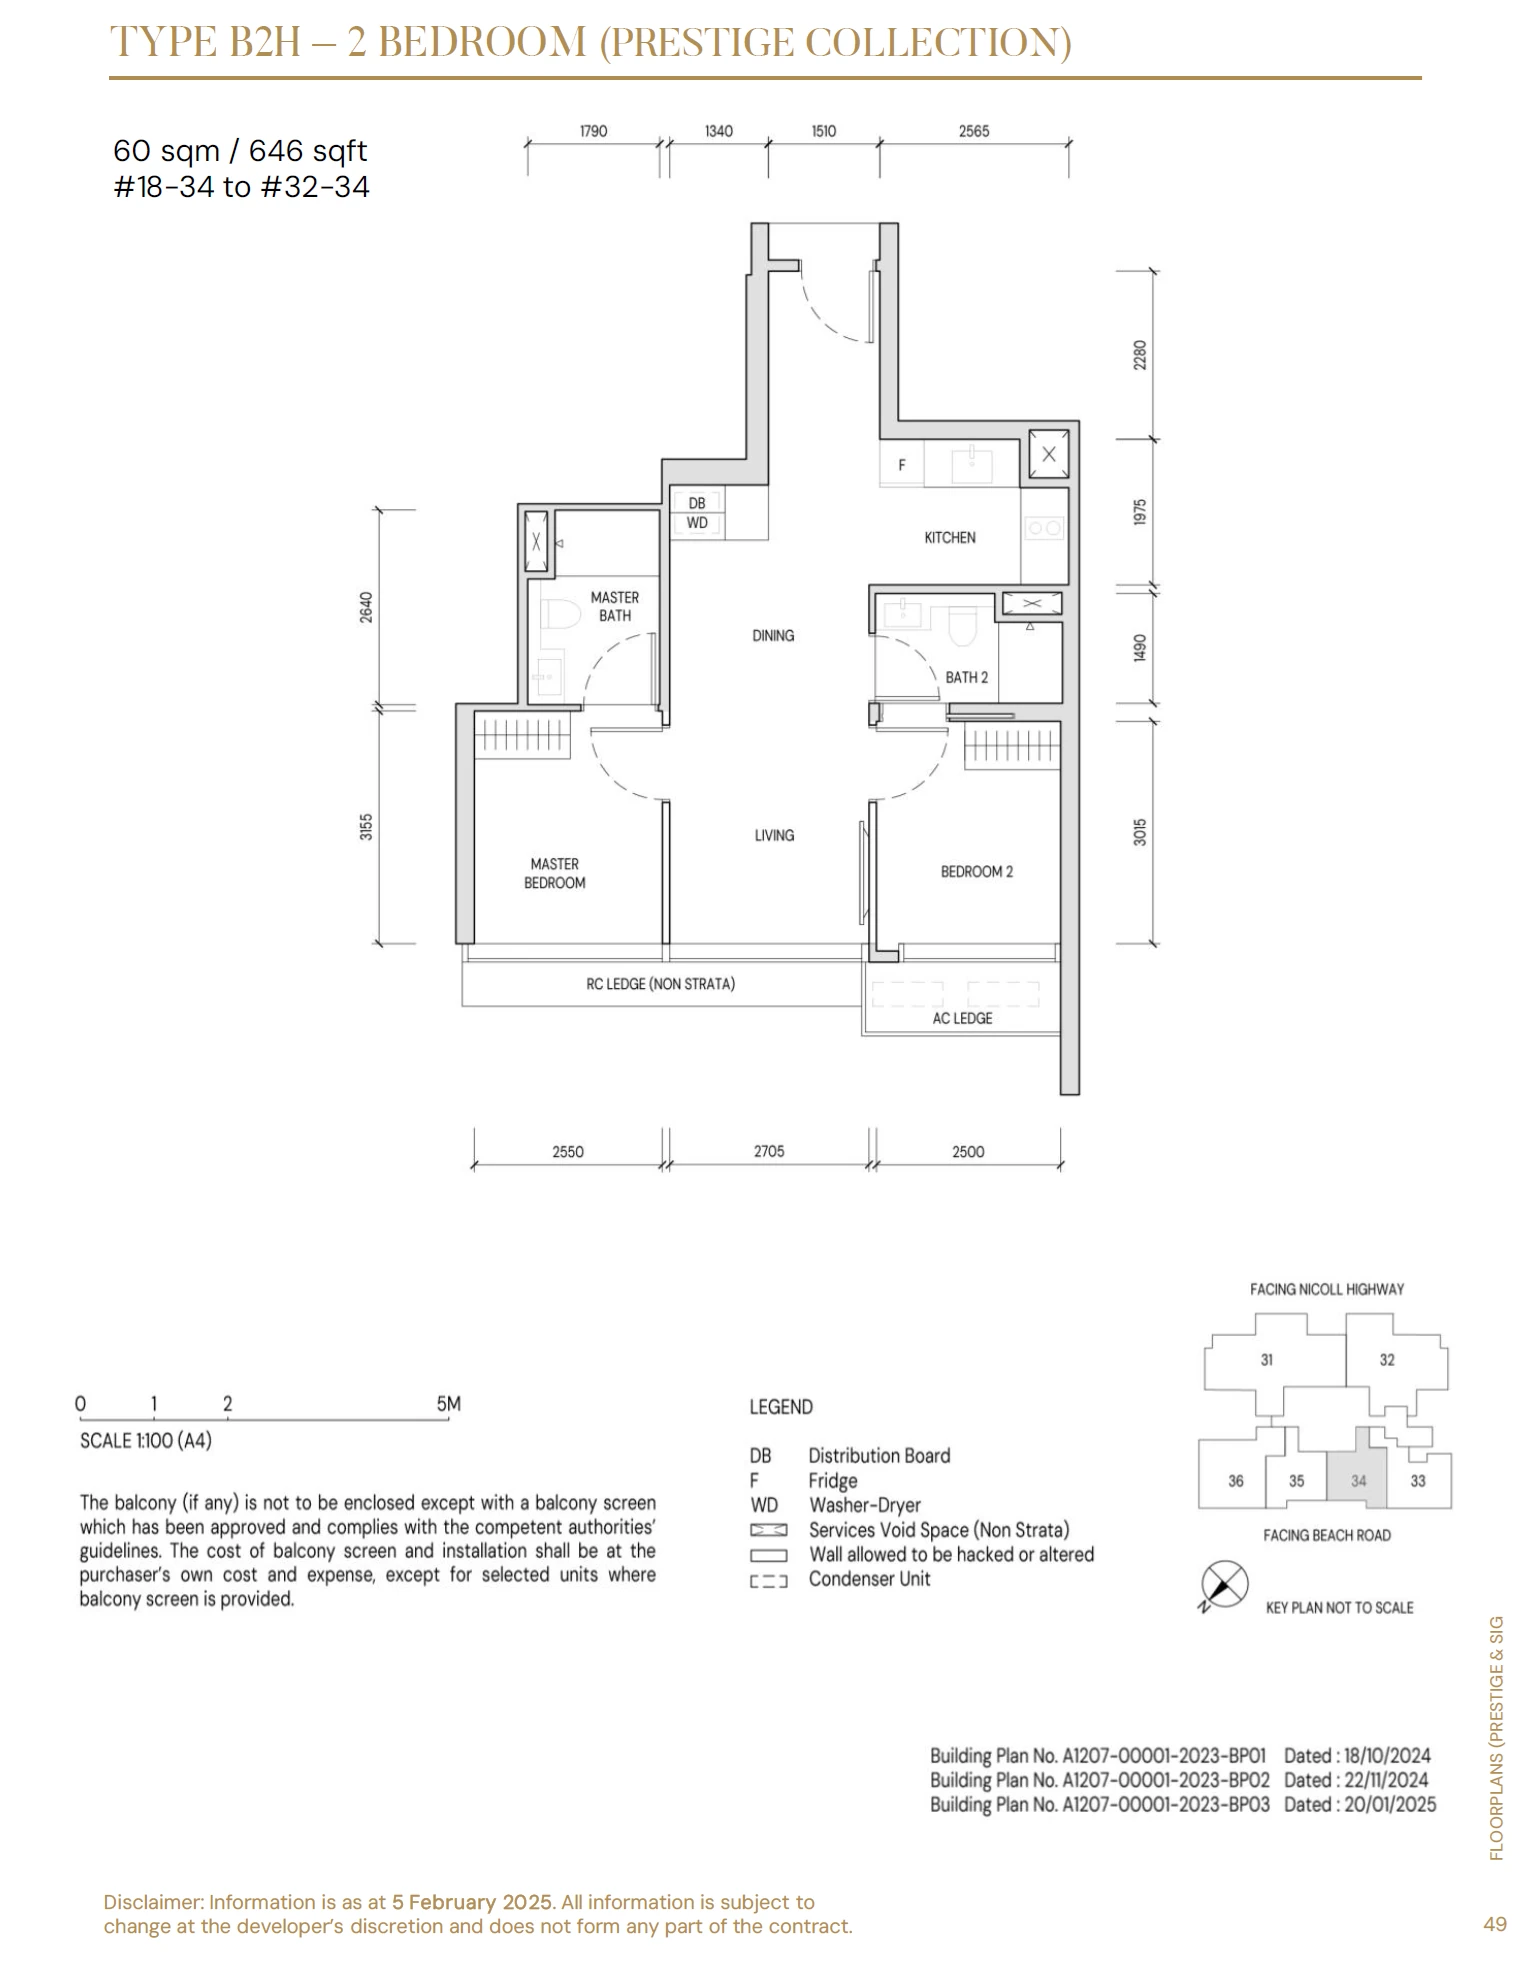
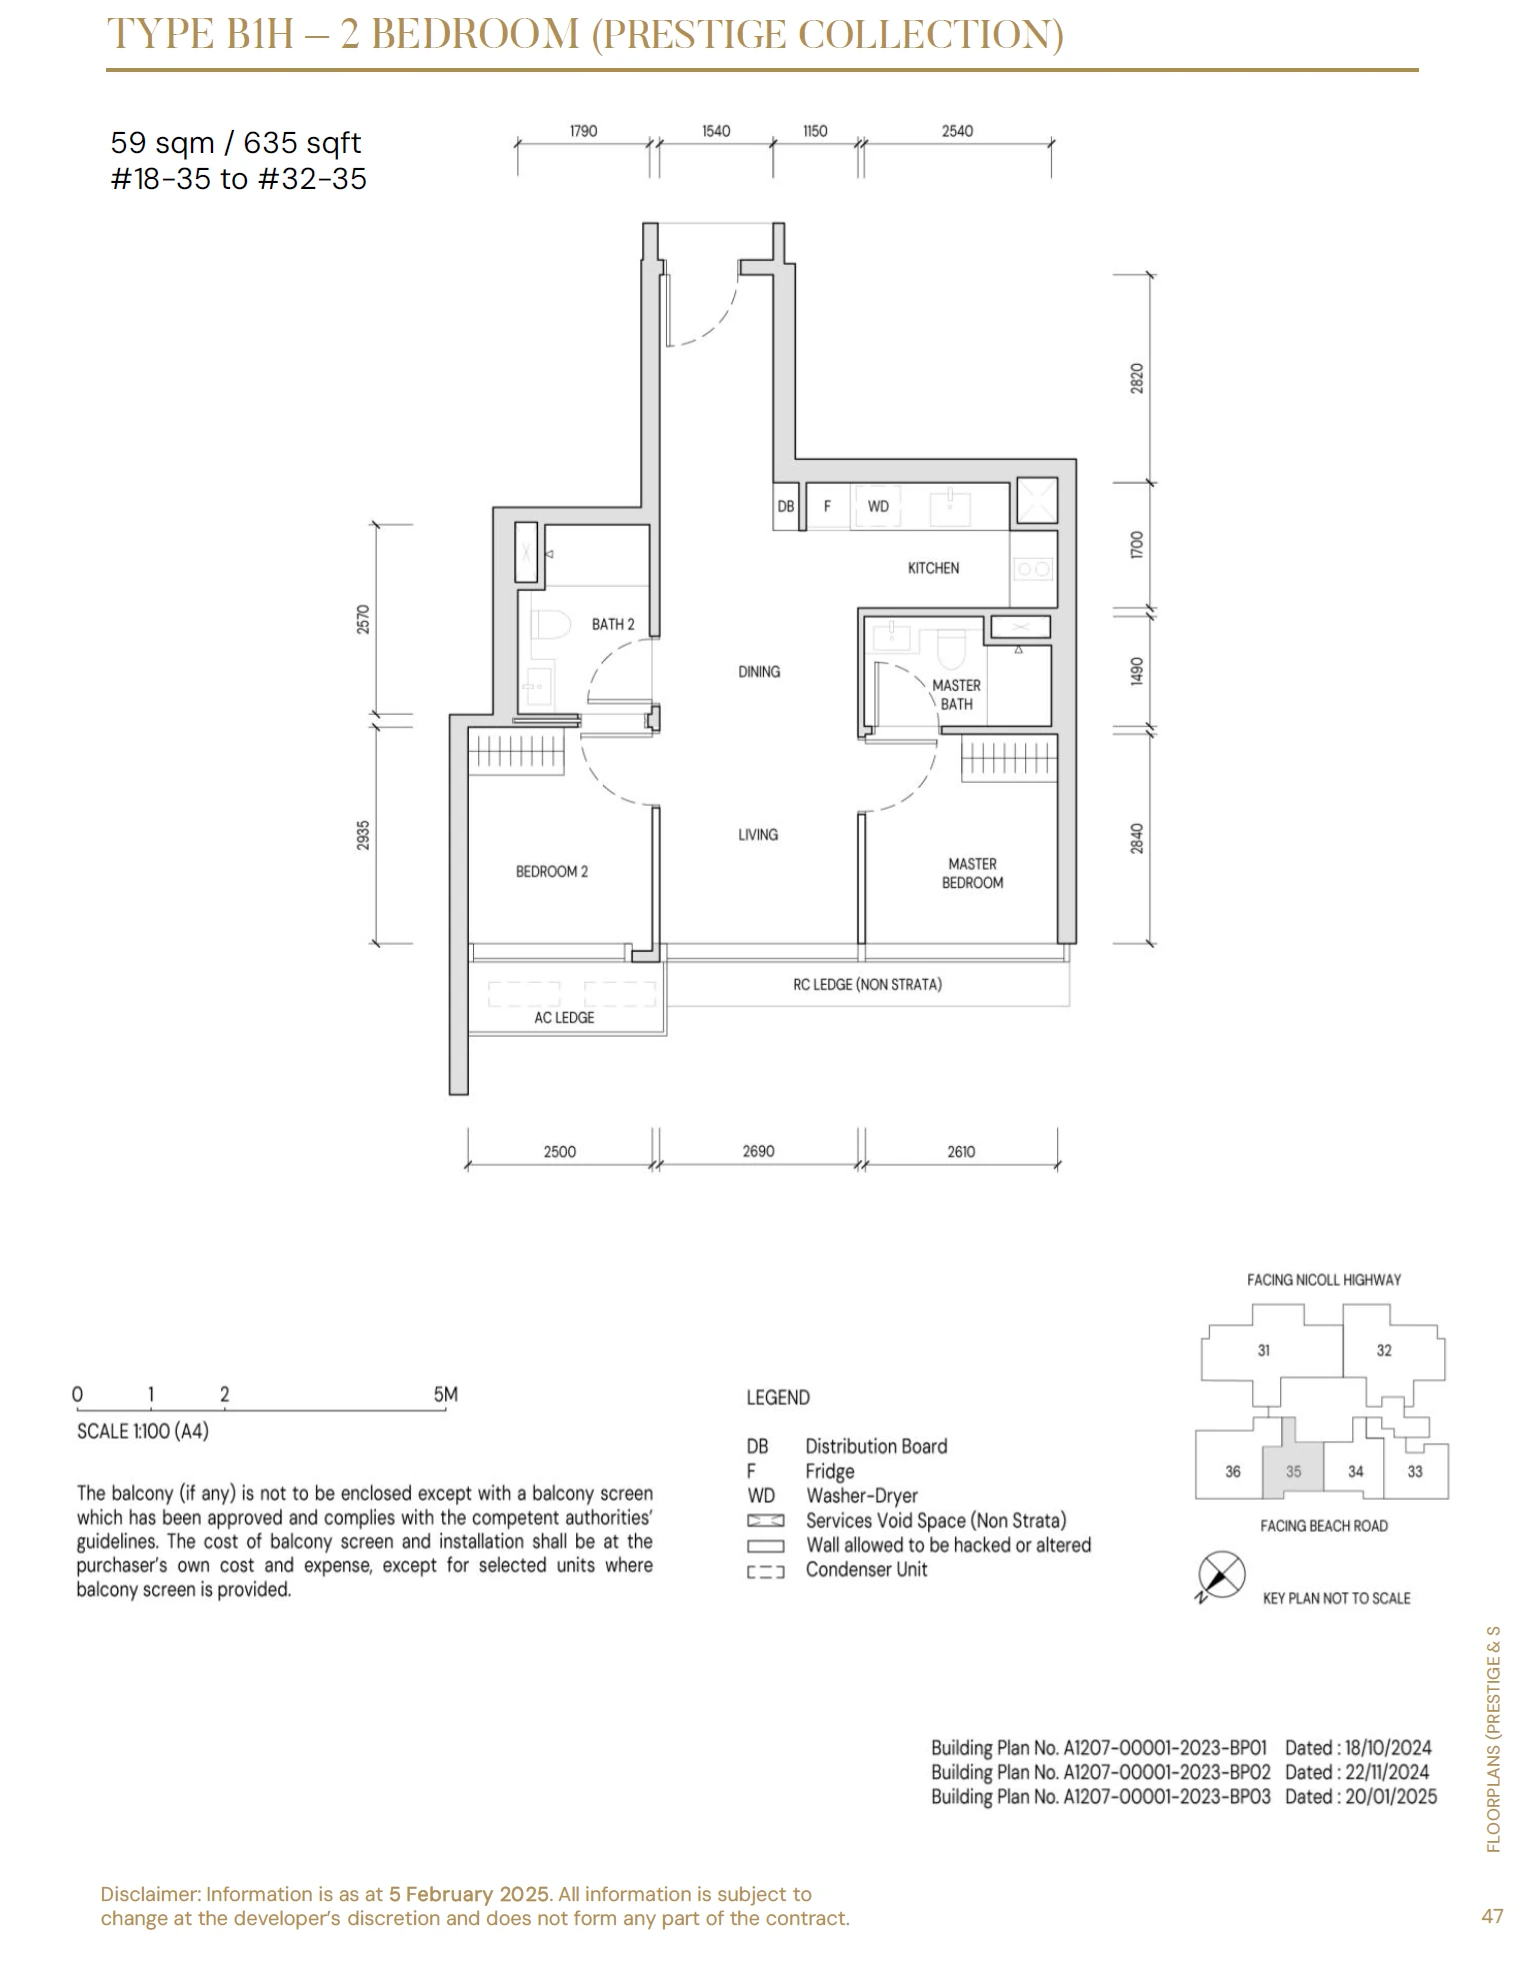
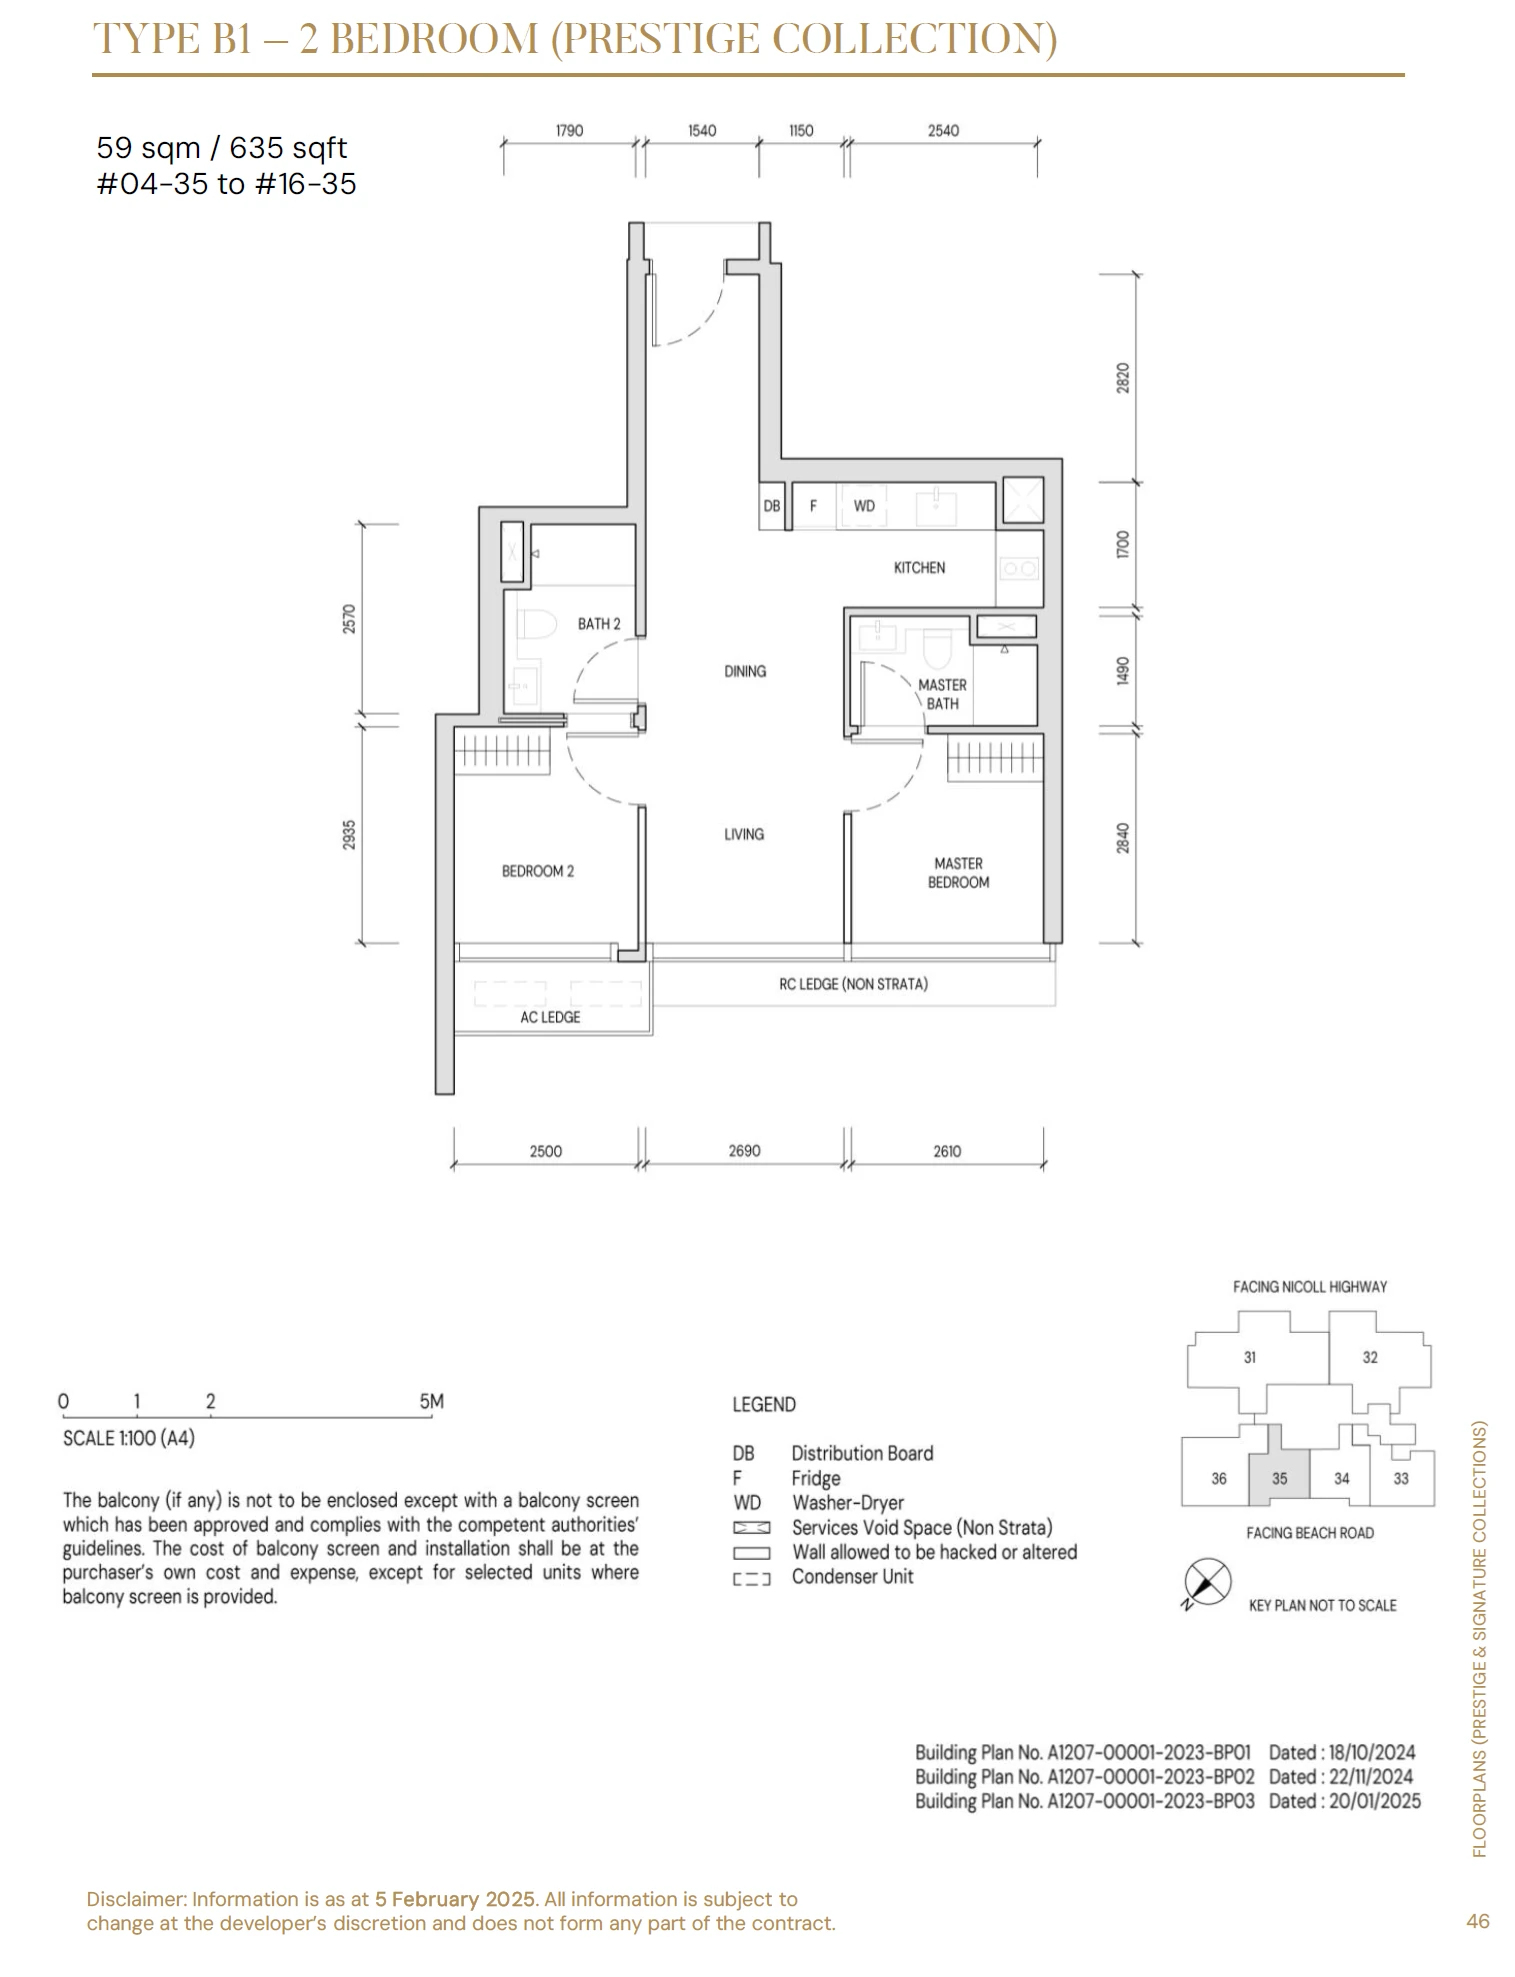
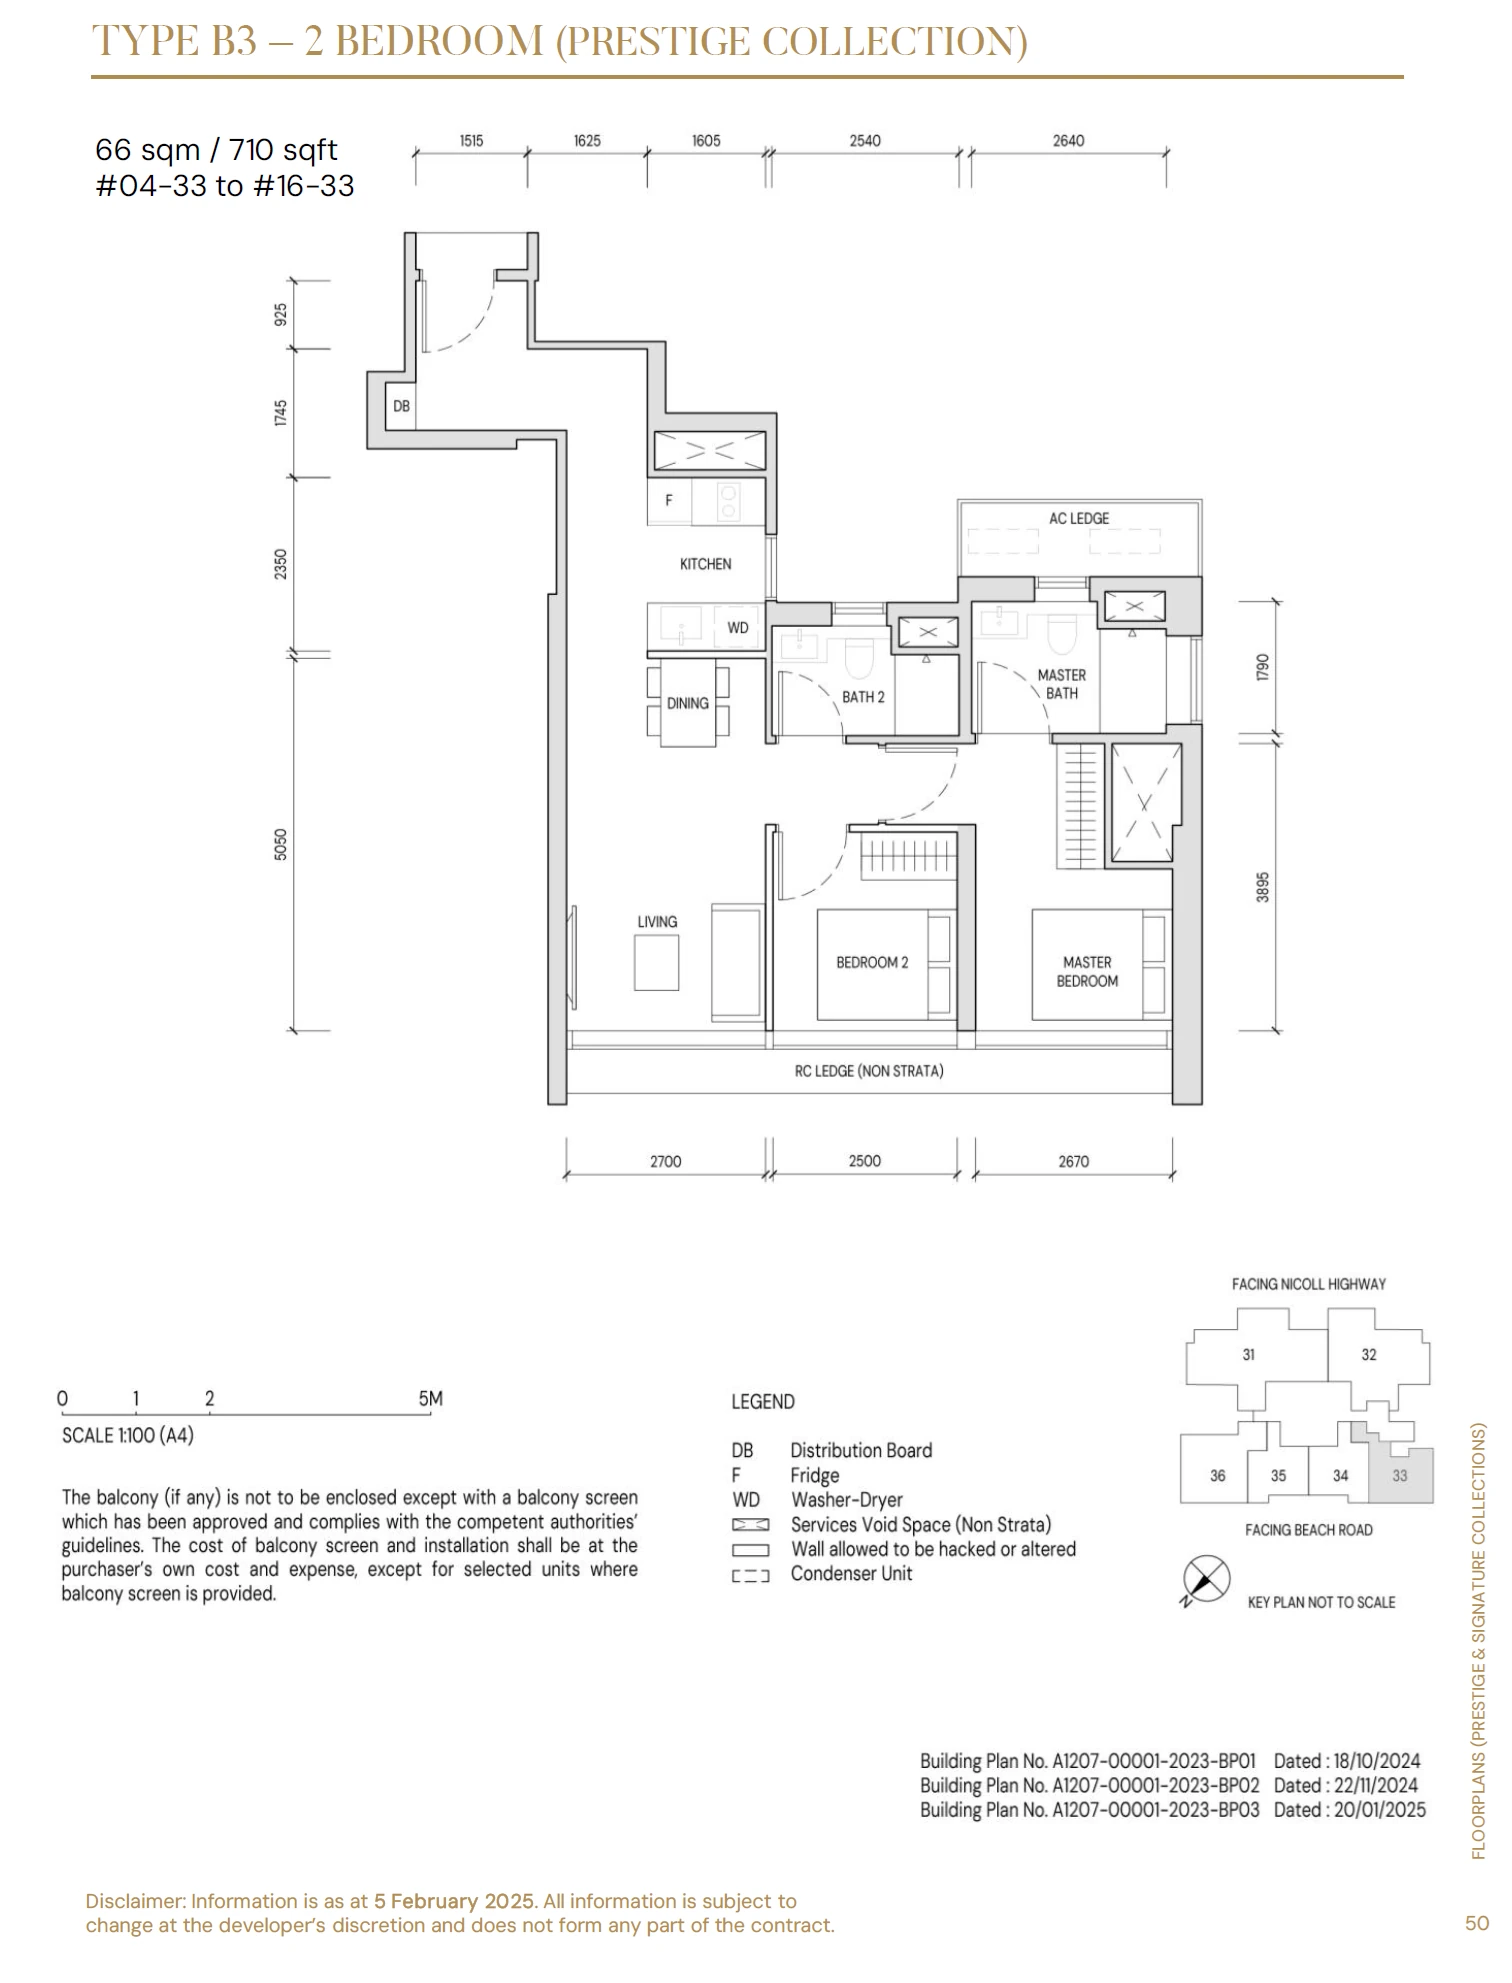
View all 21 floorplan sheets
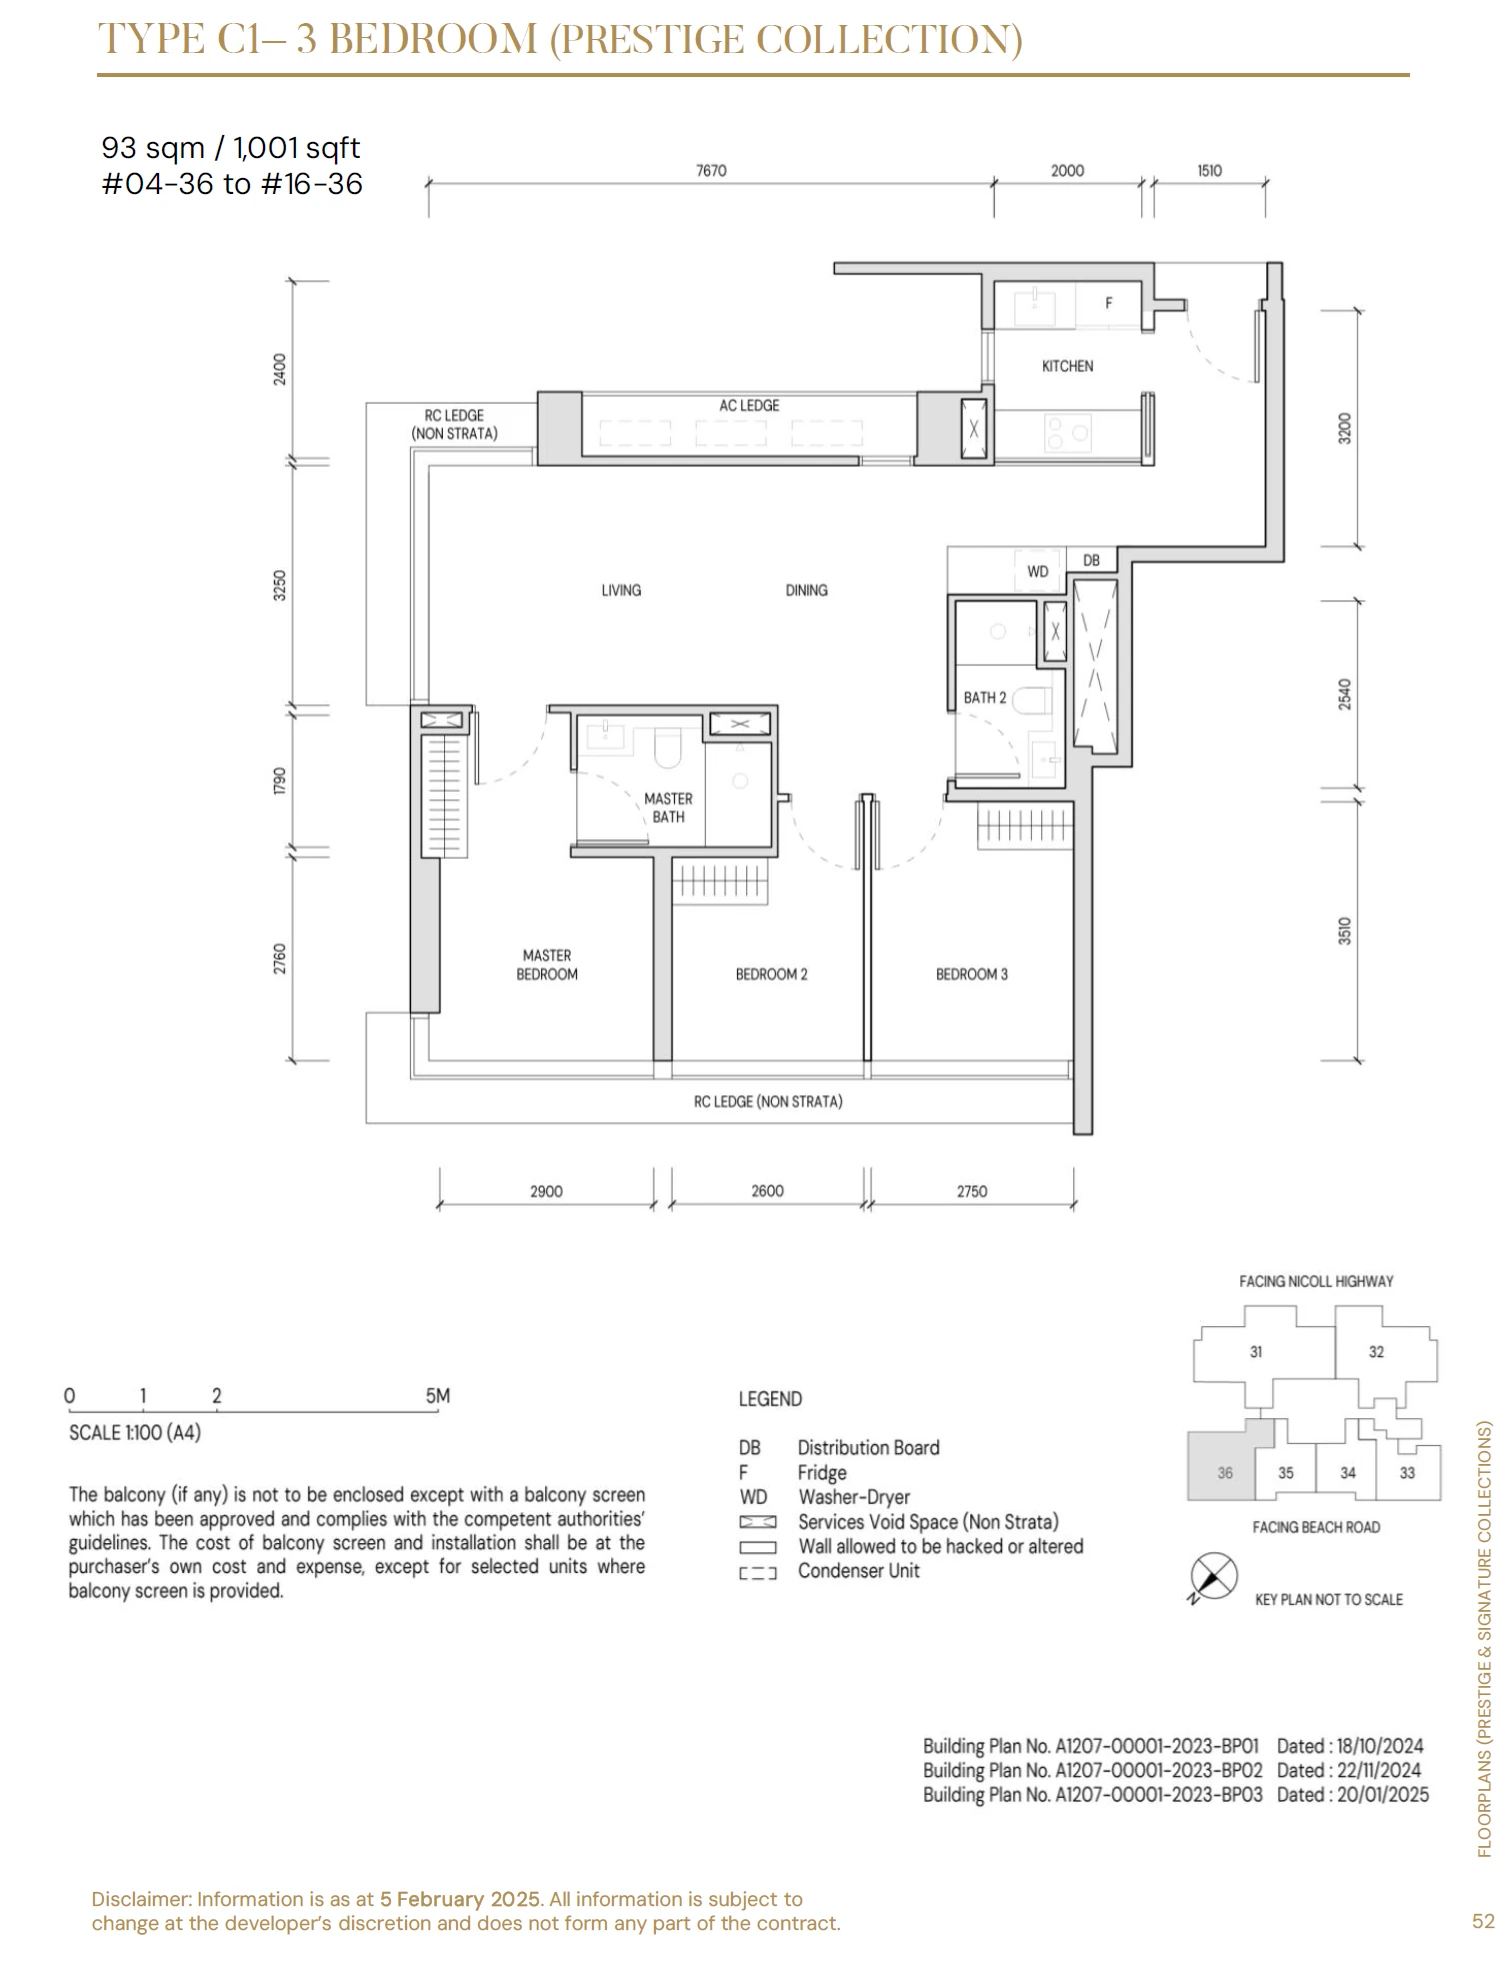
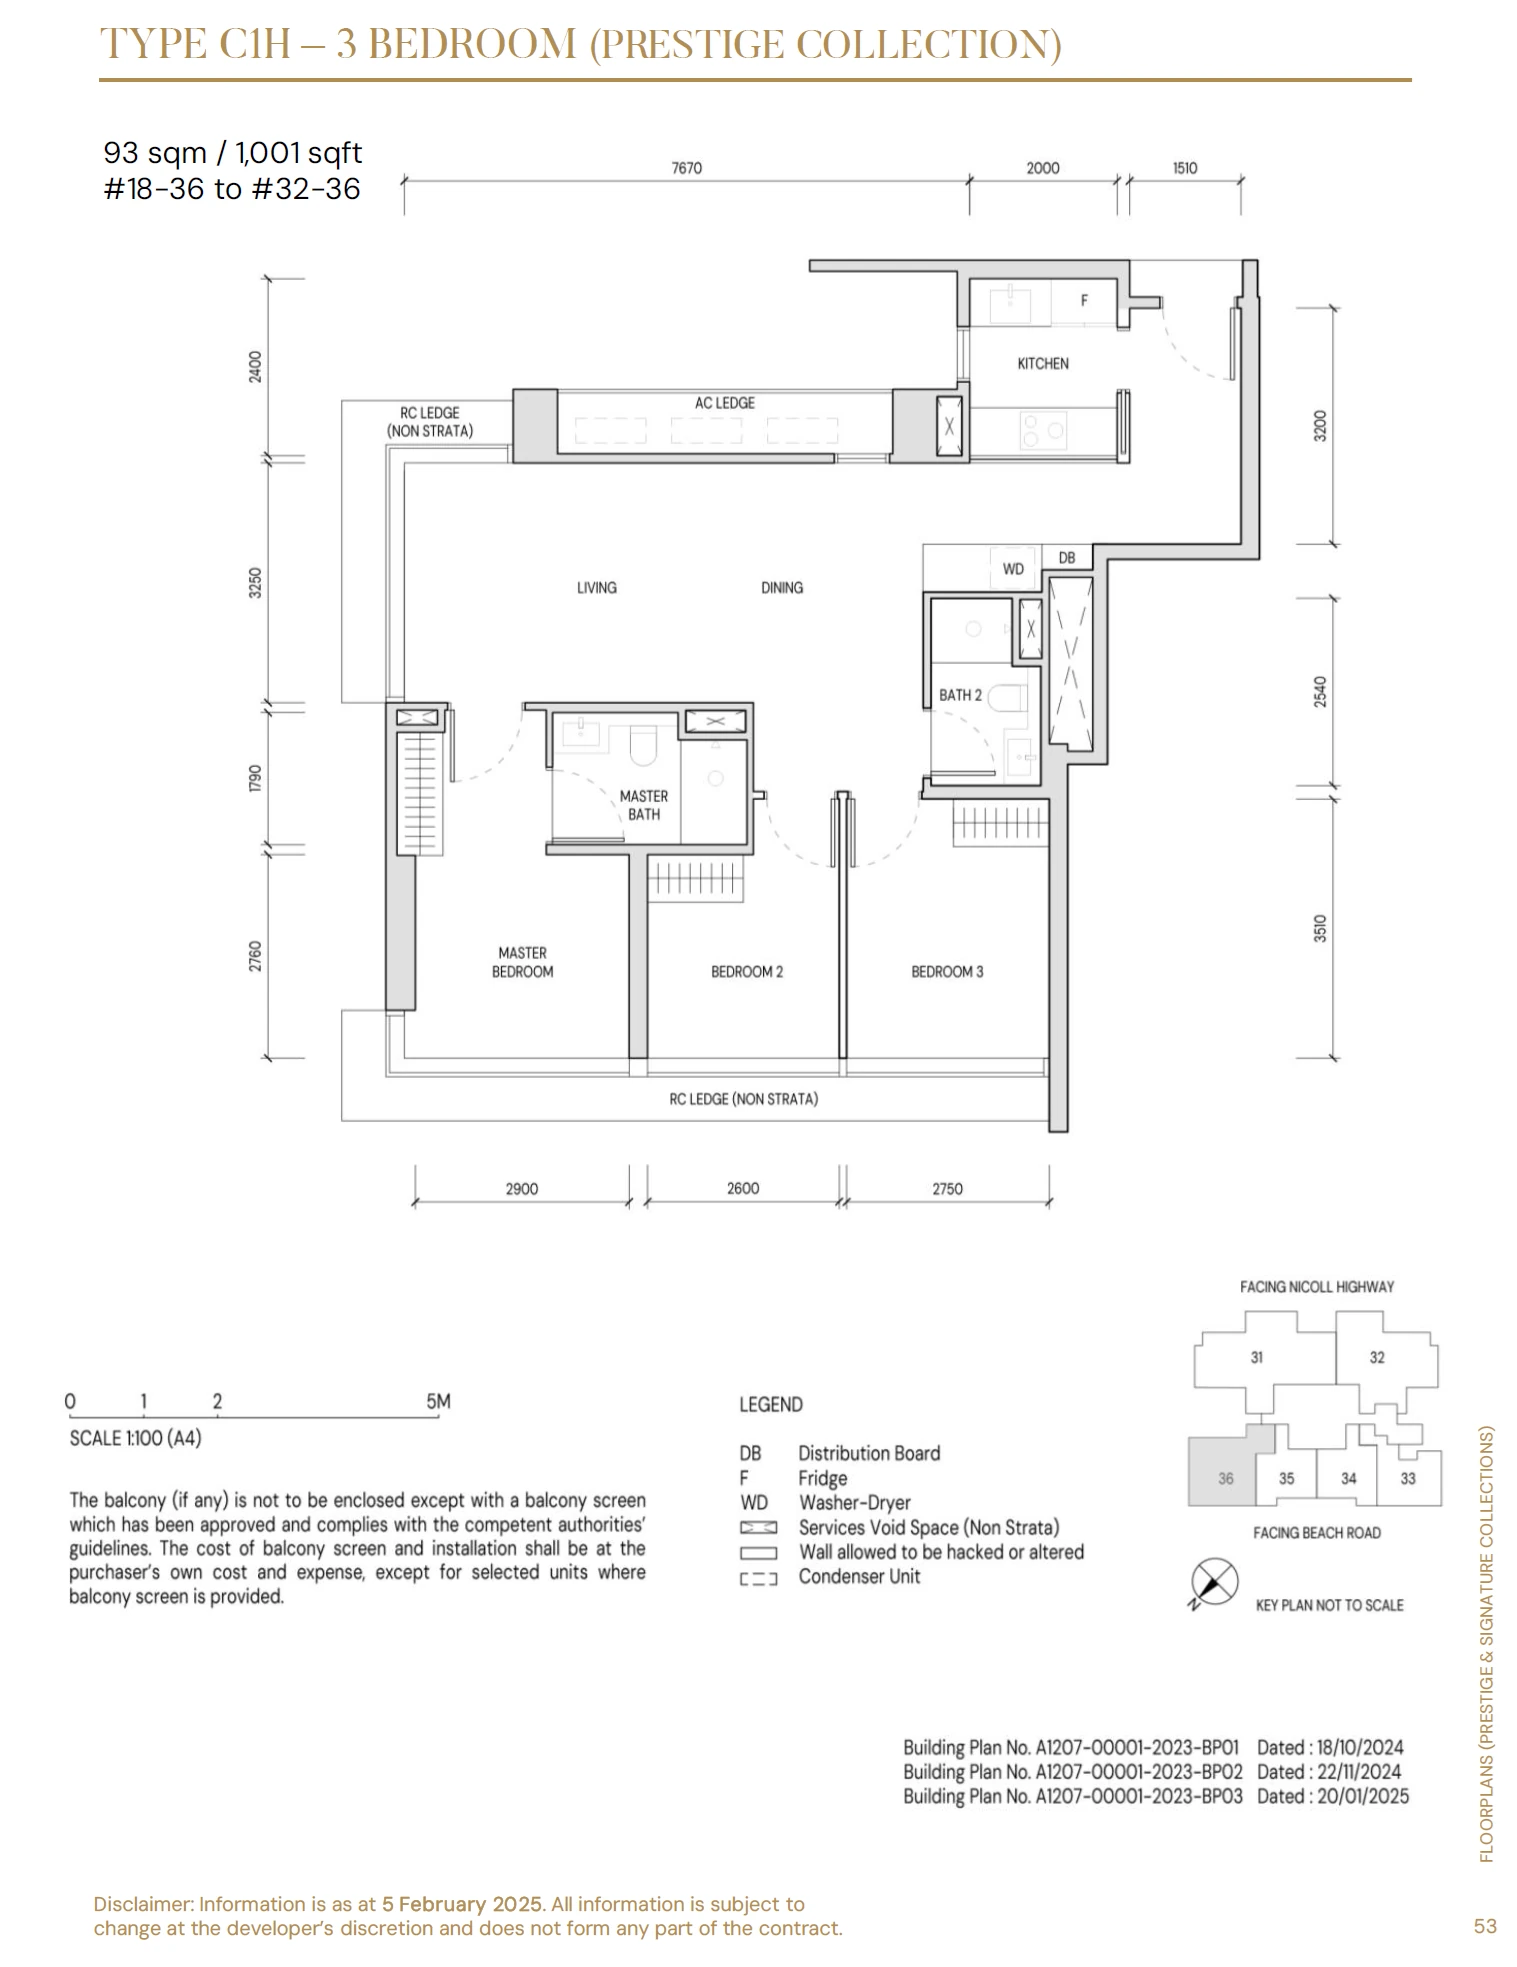
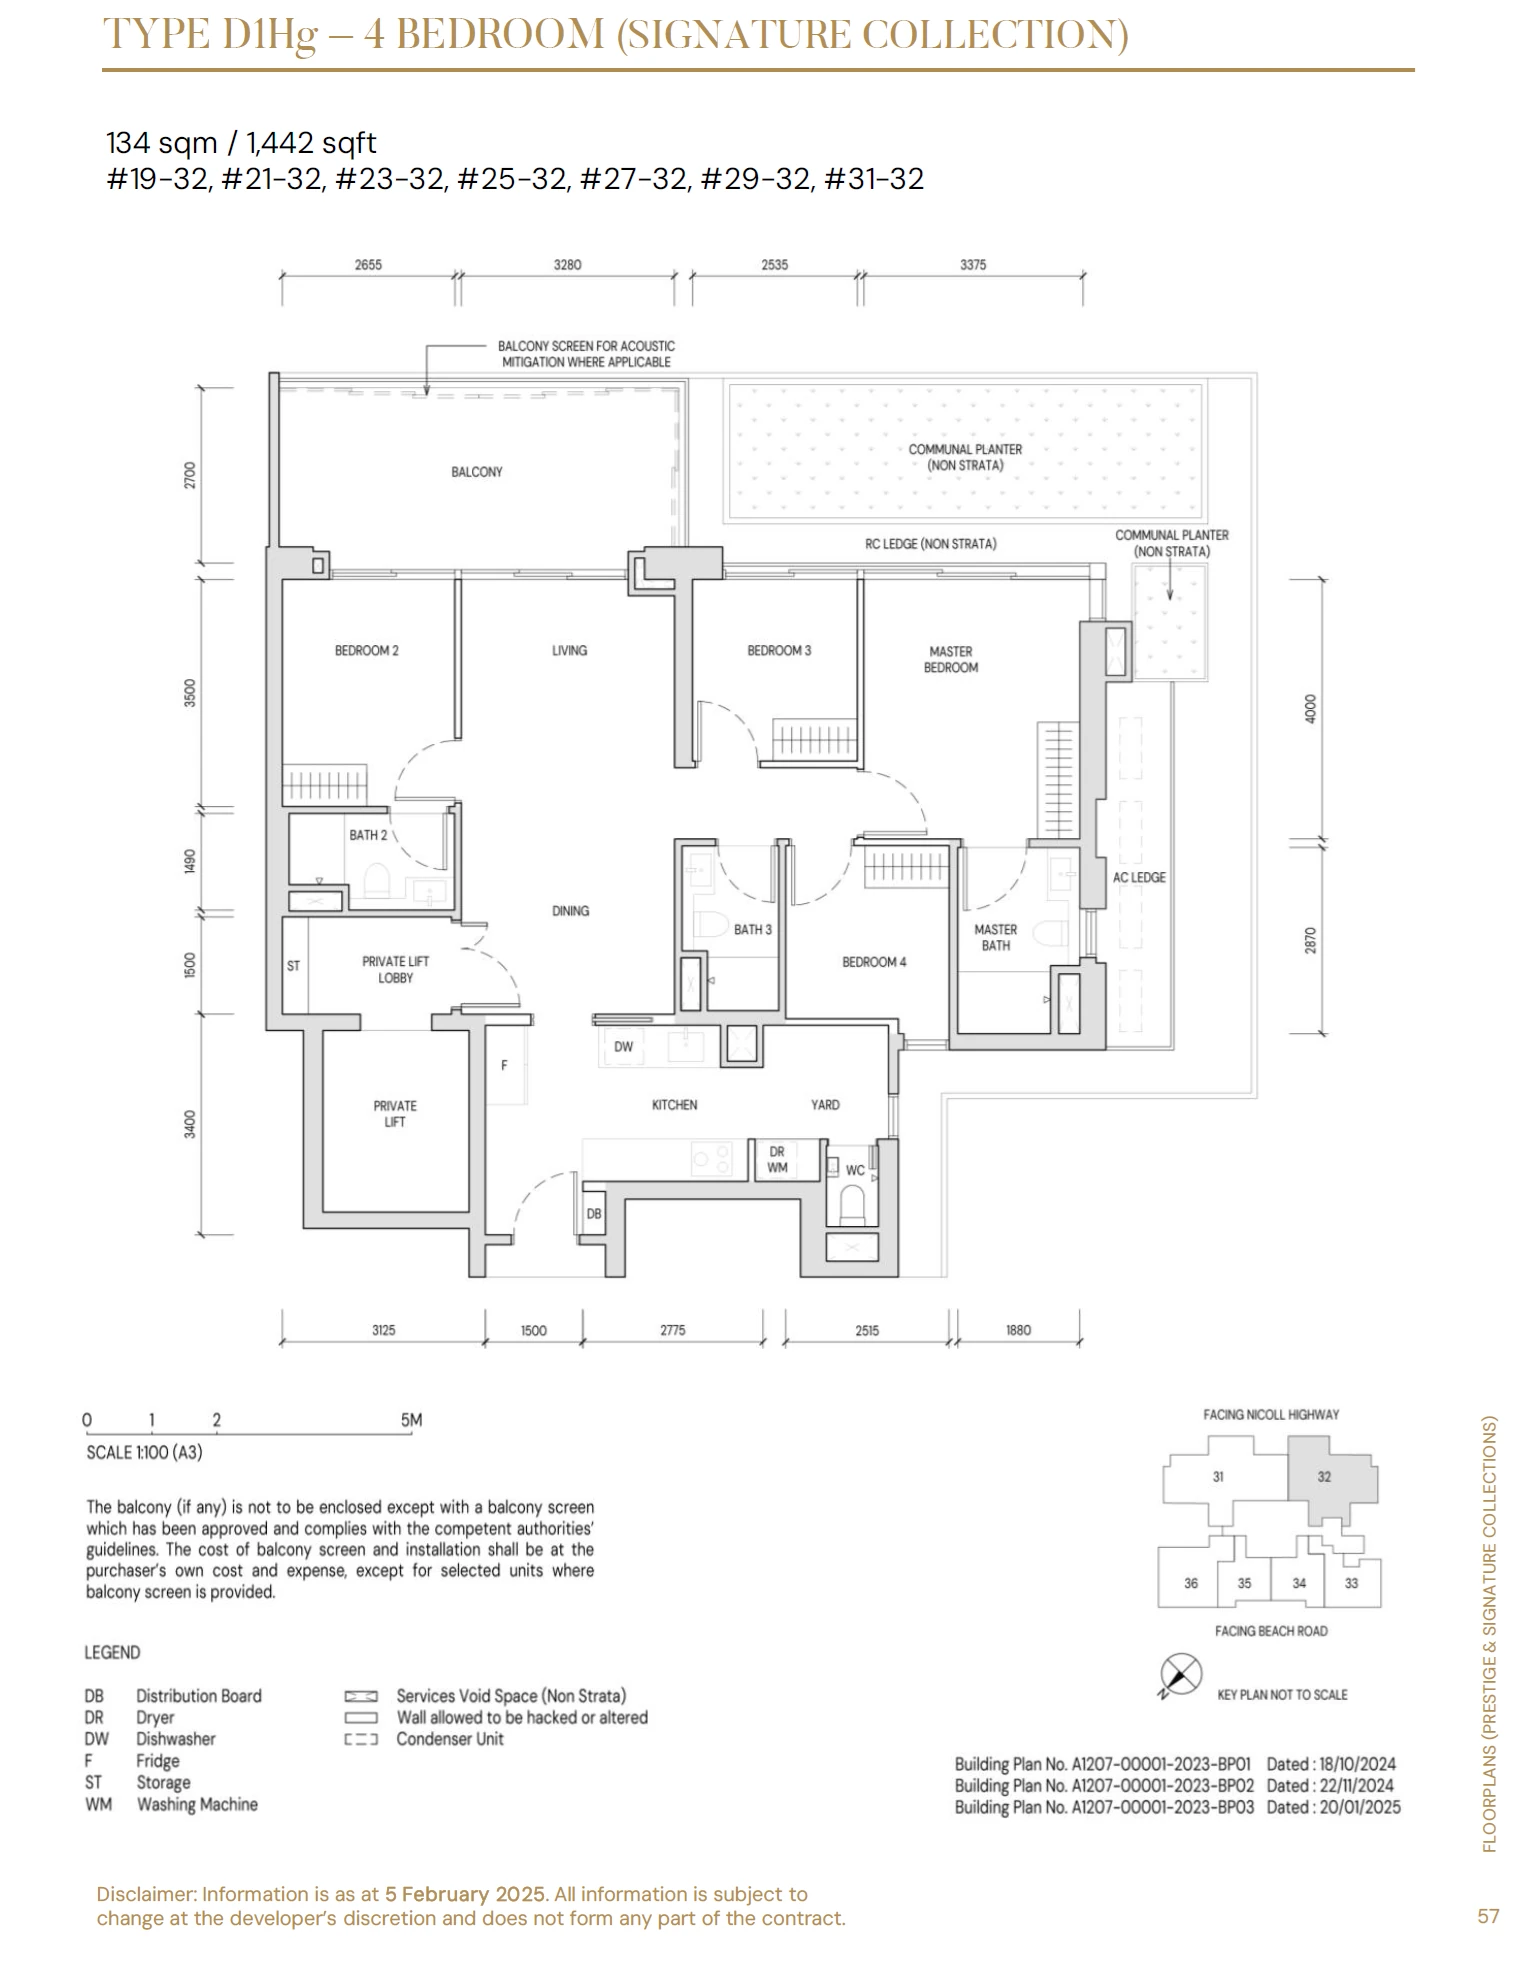
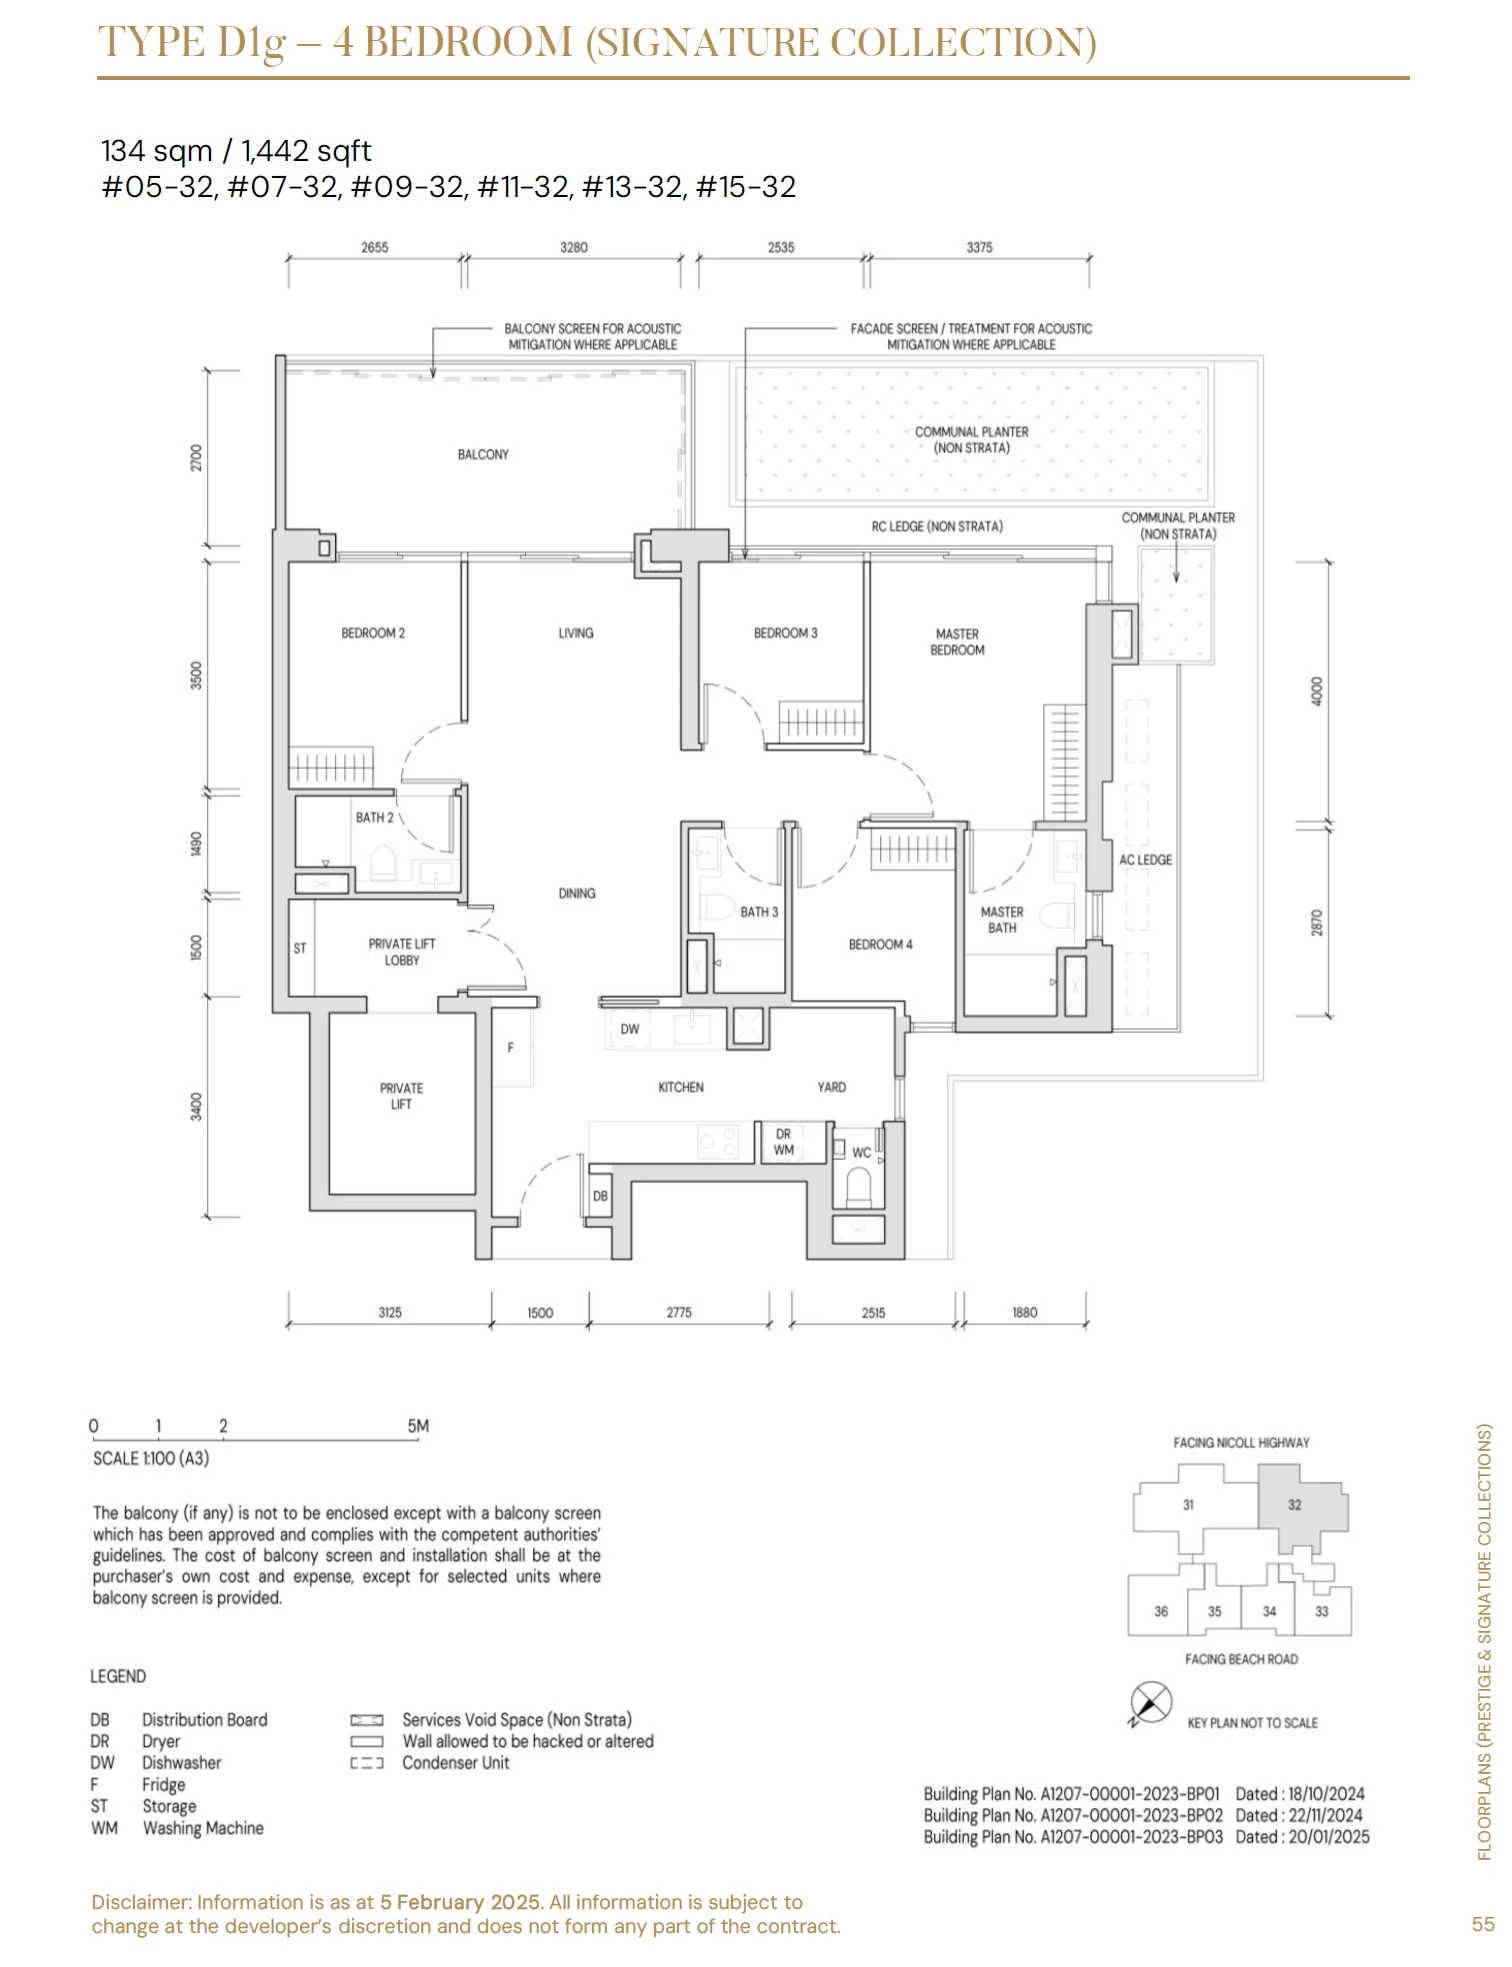
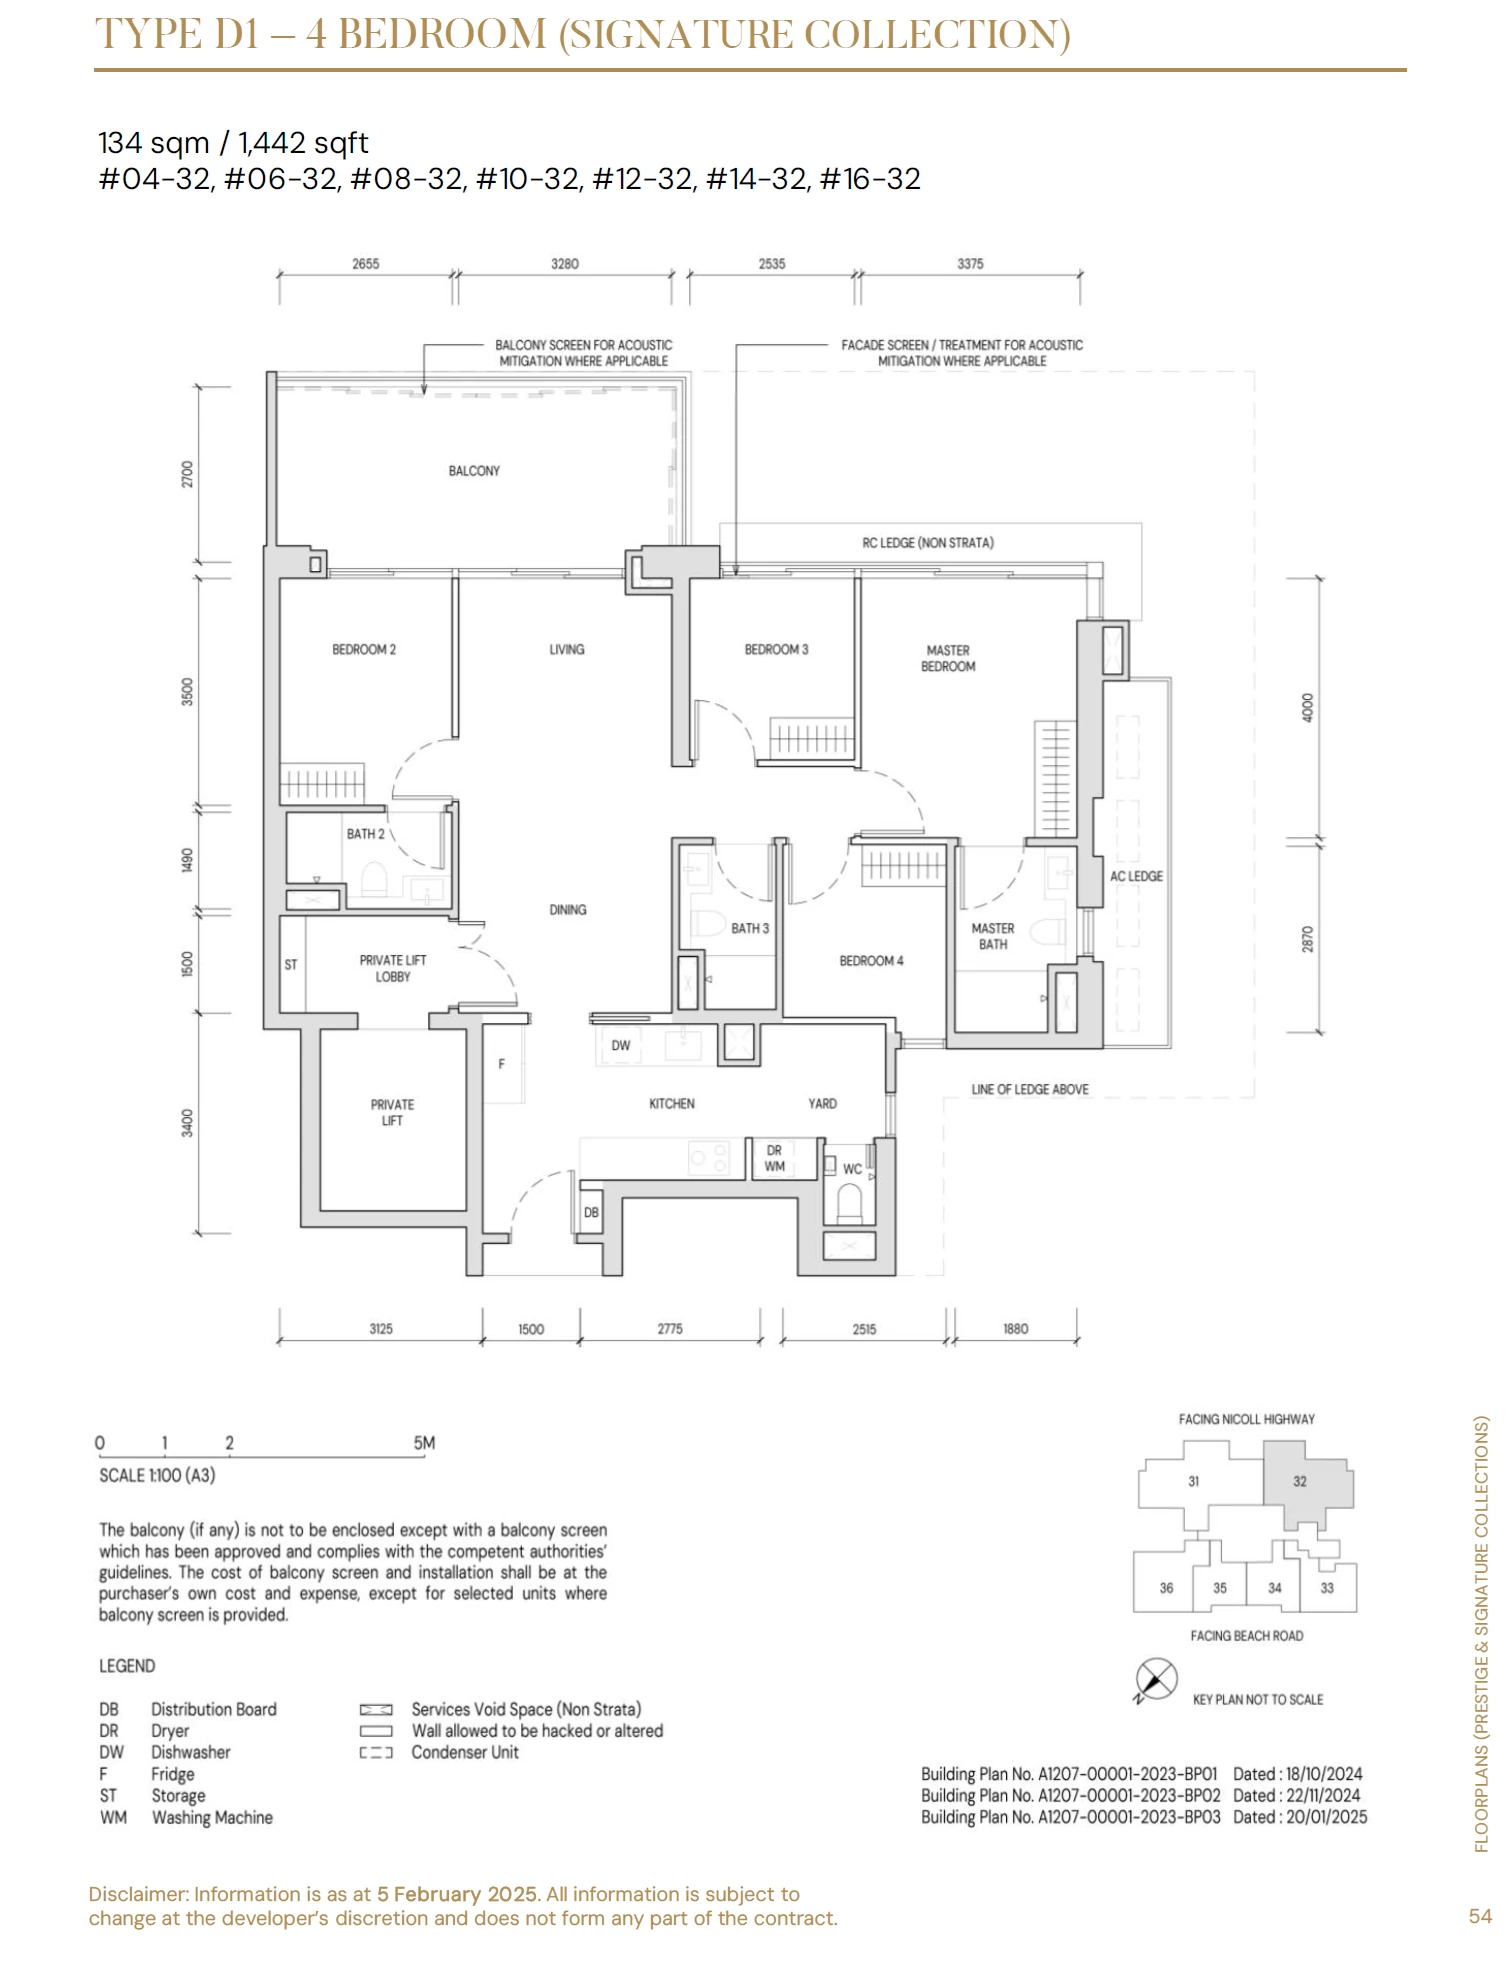
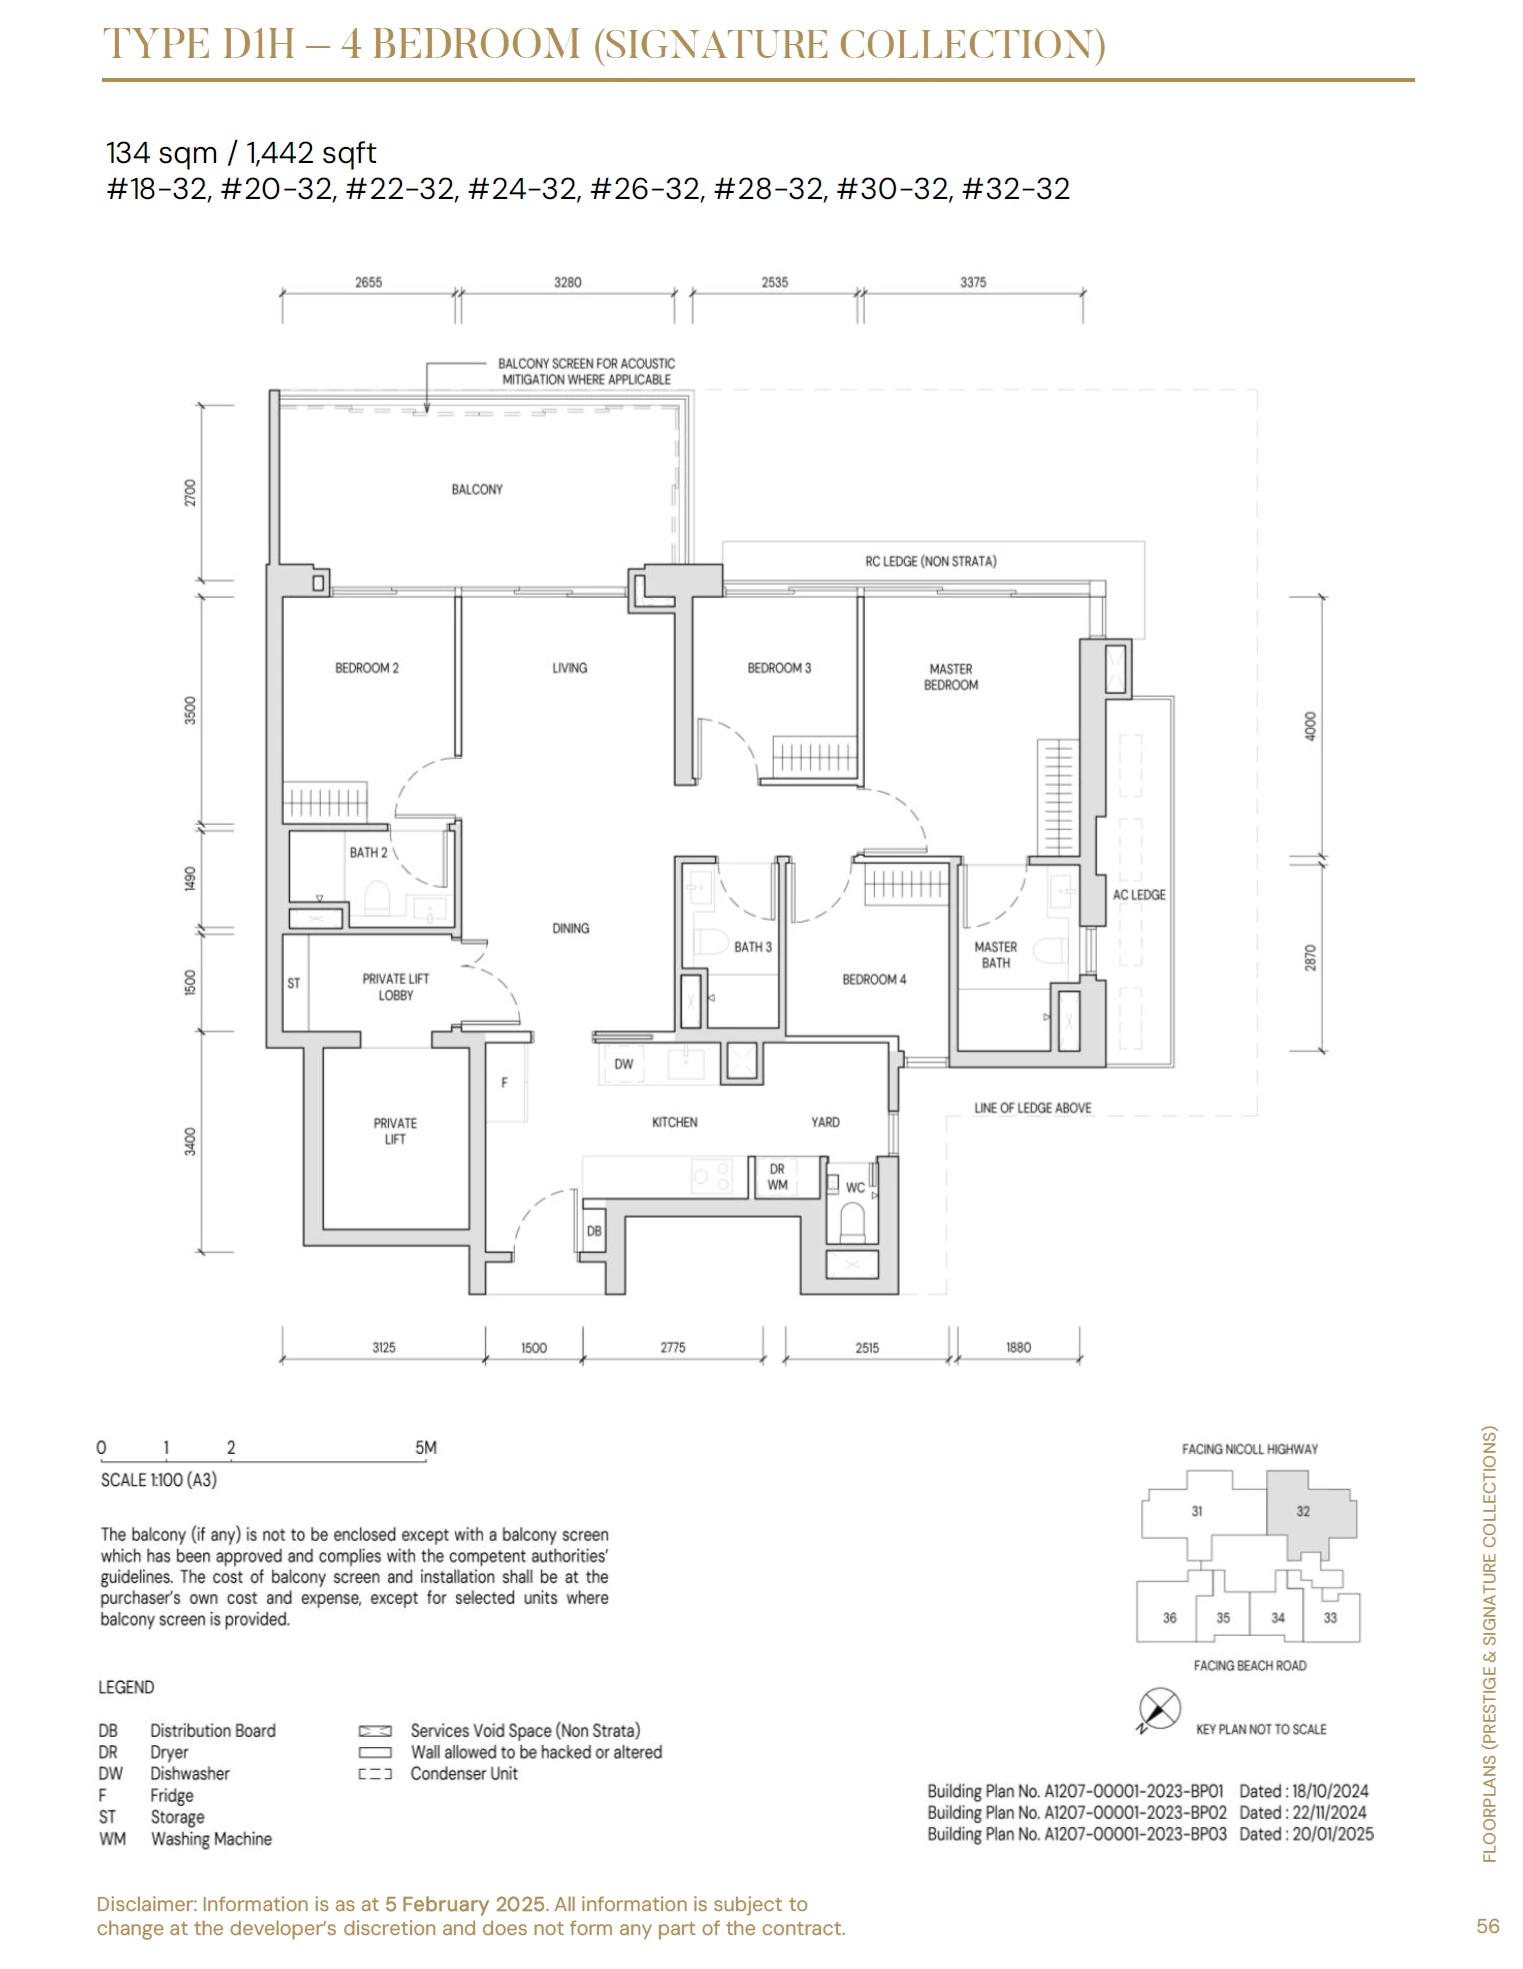
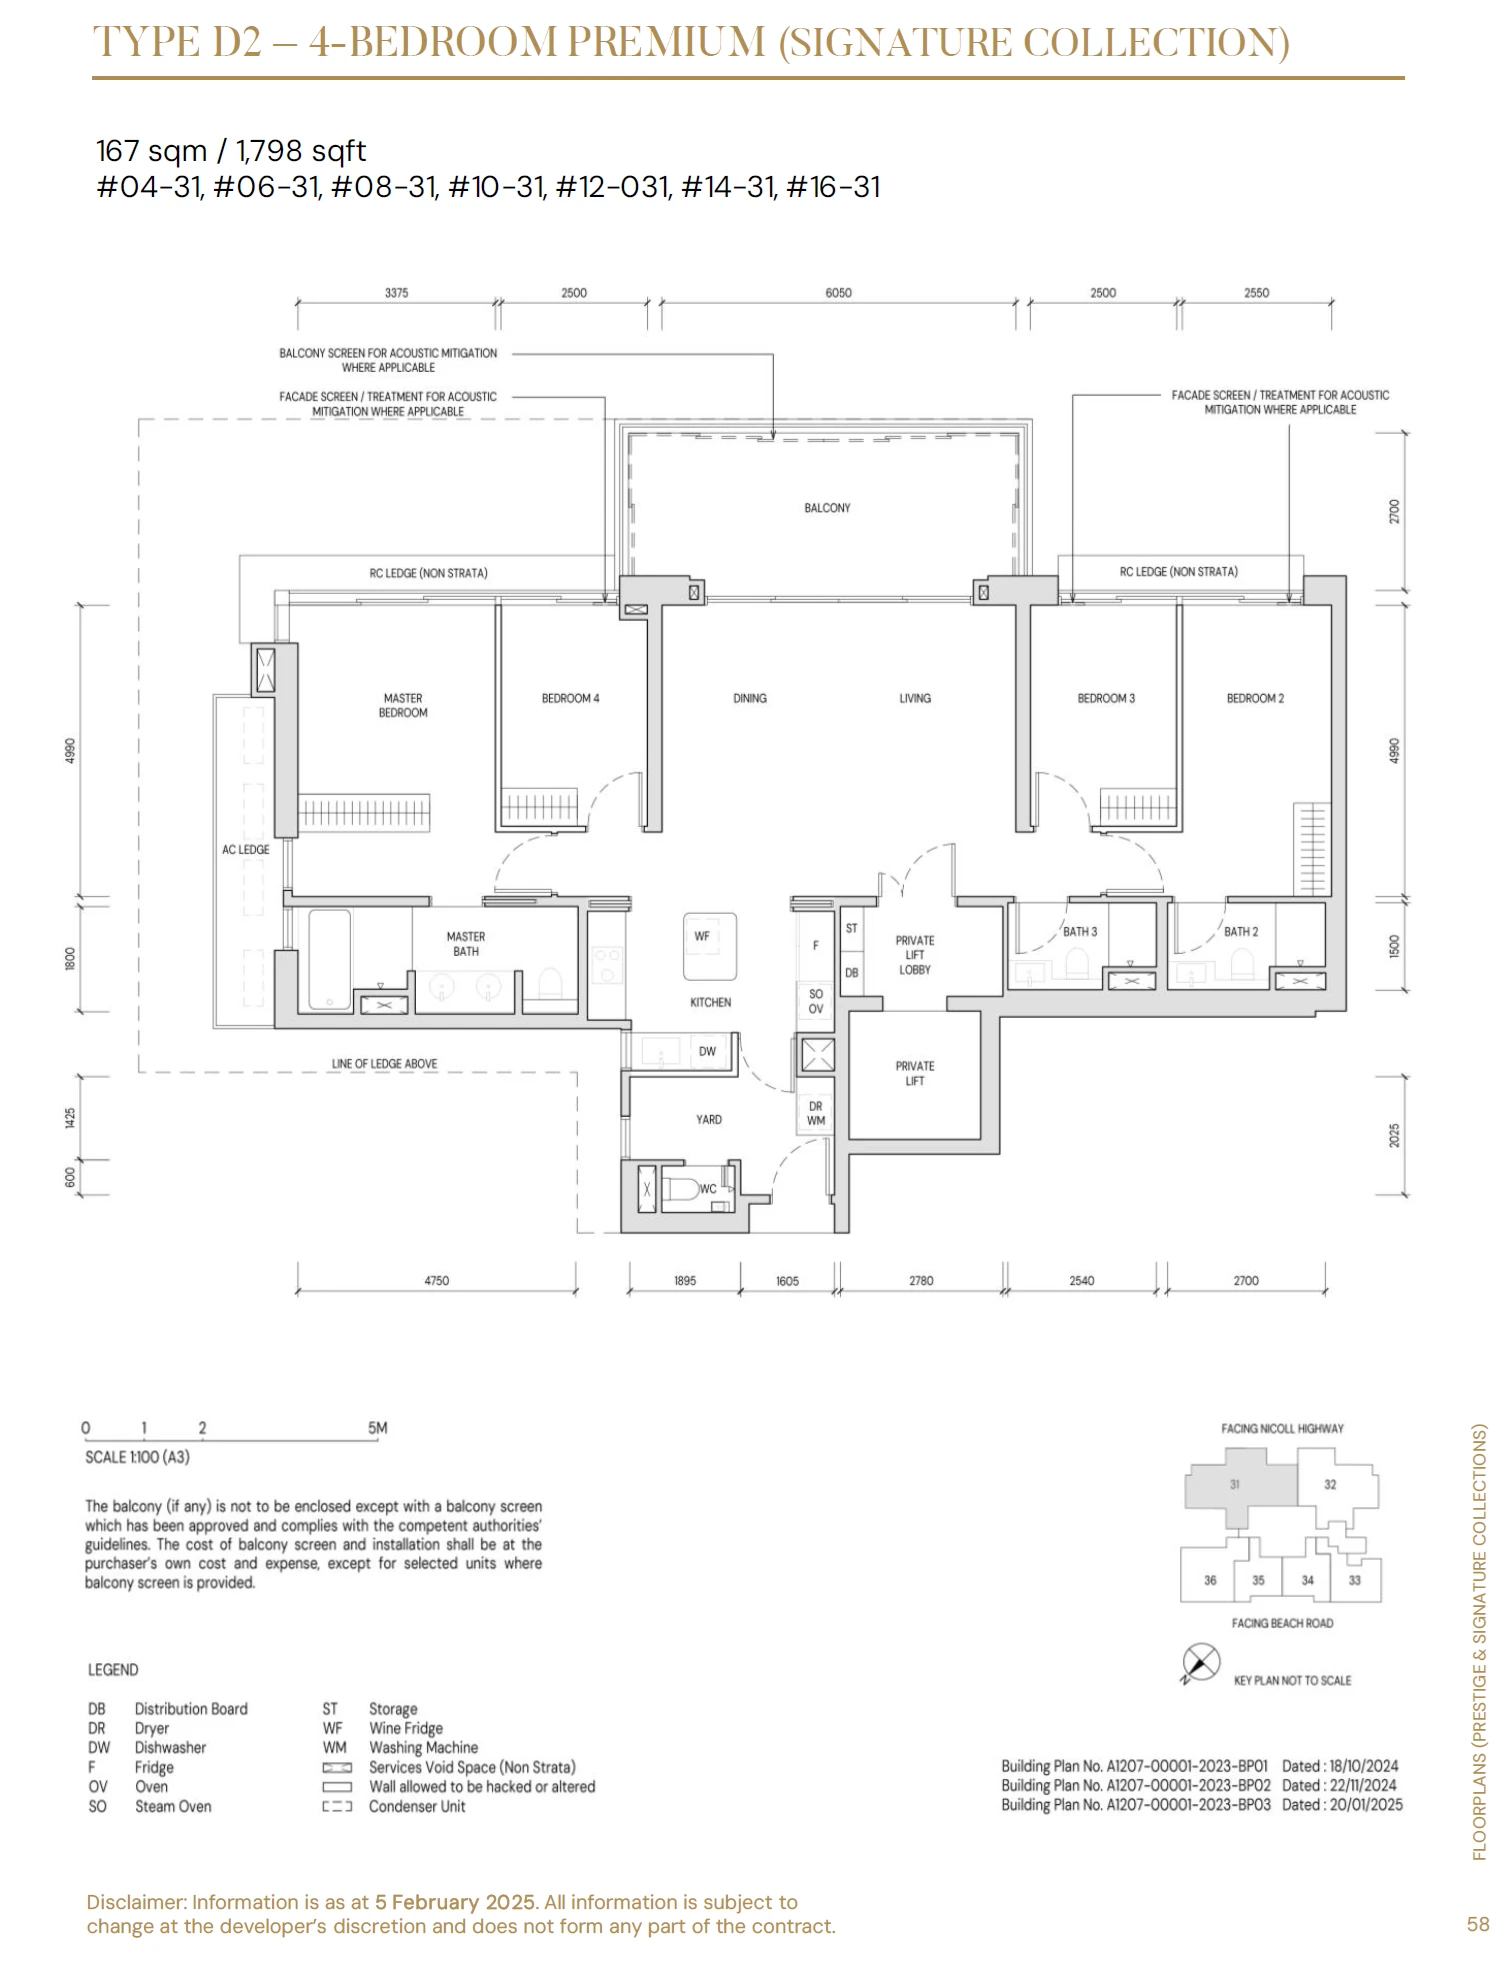
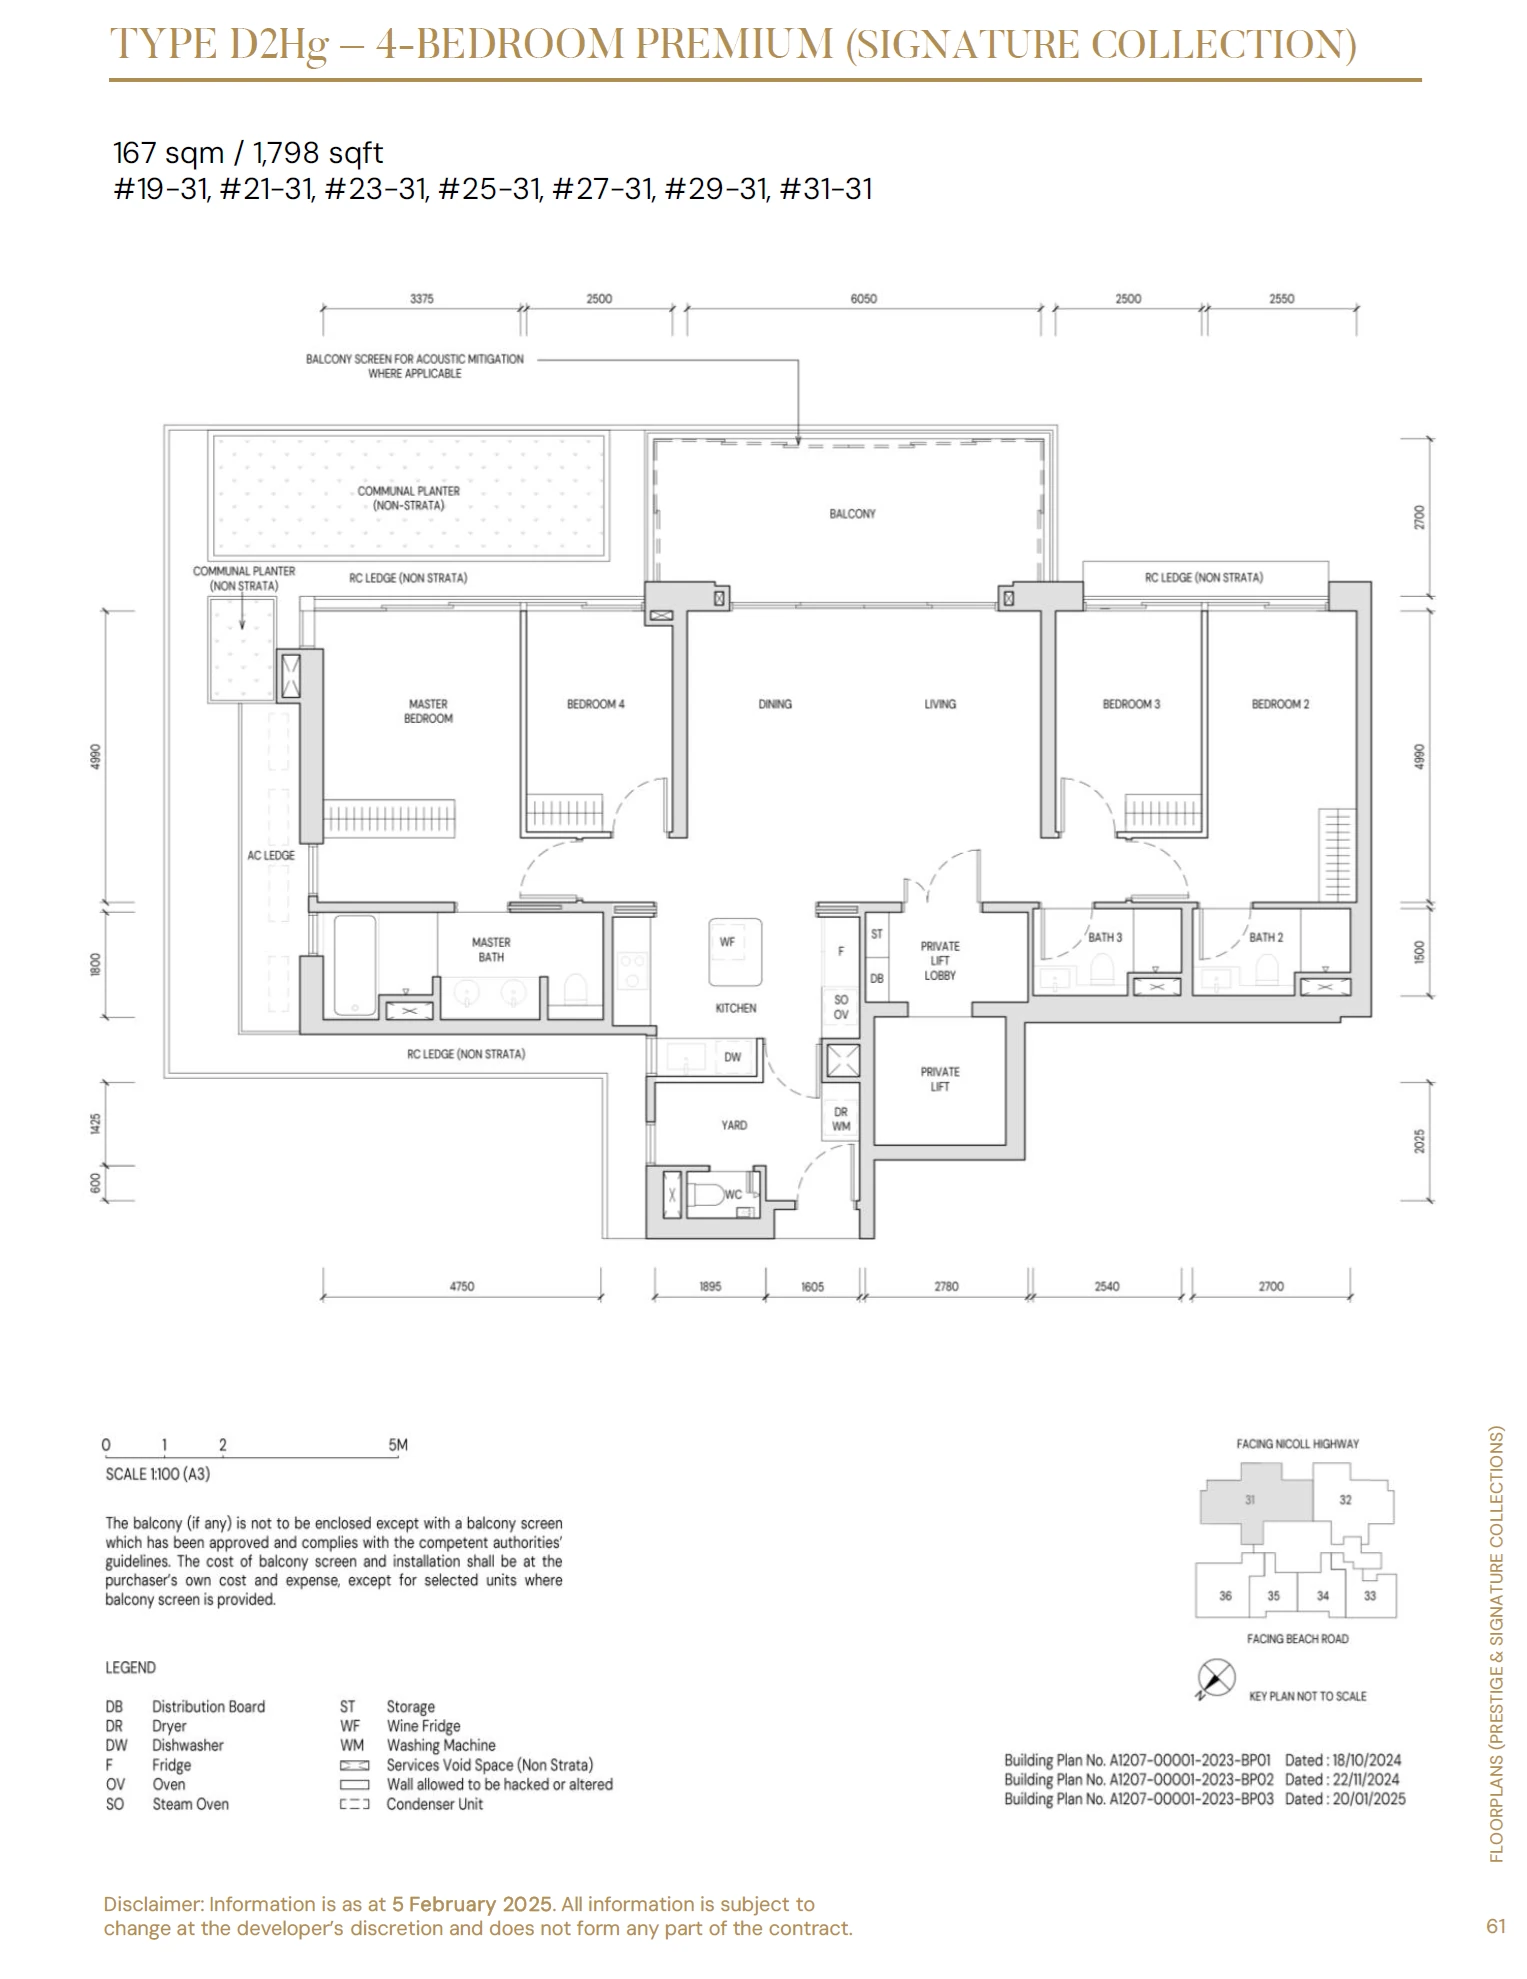
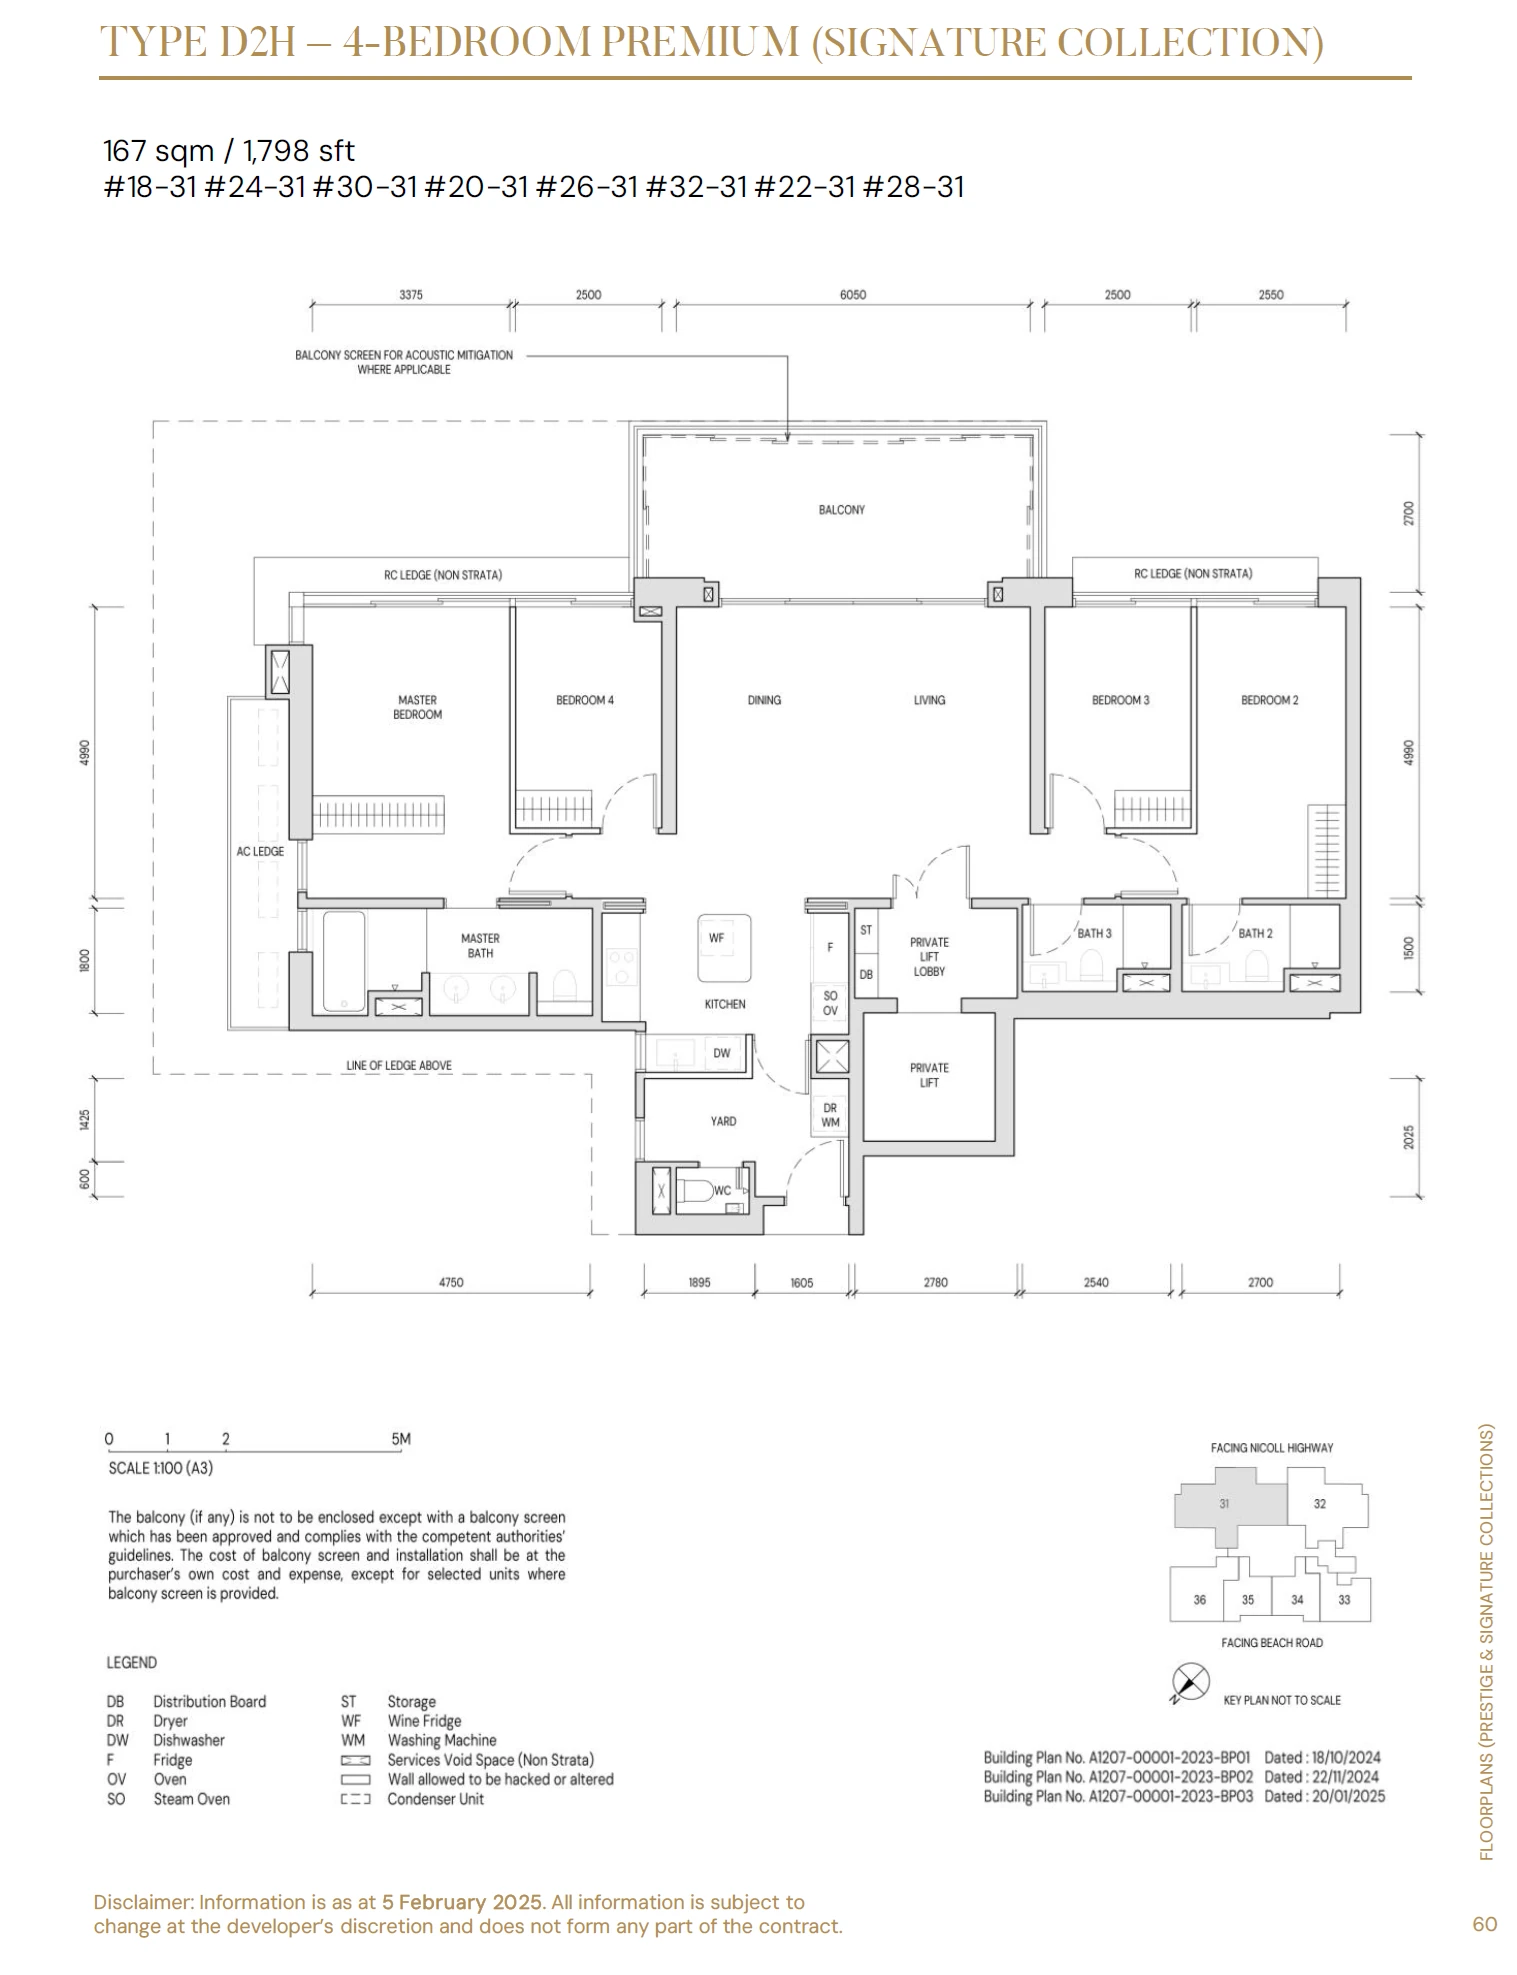
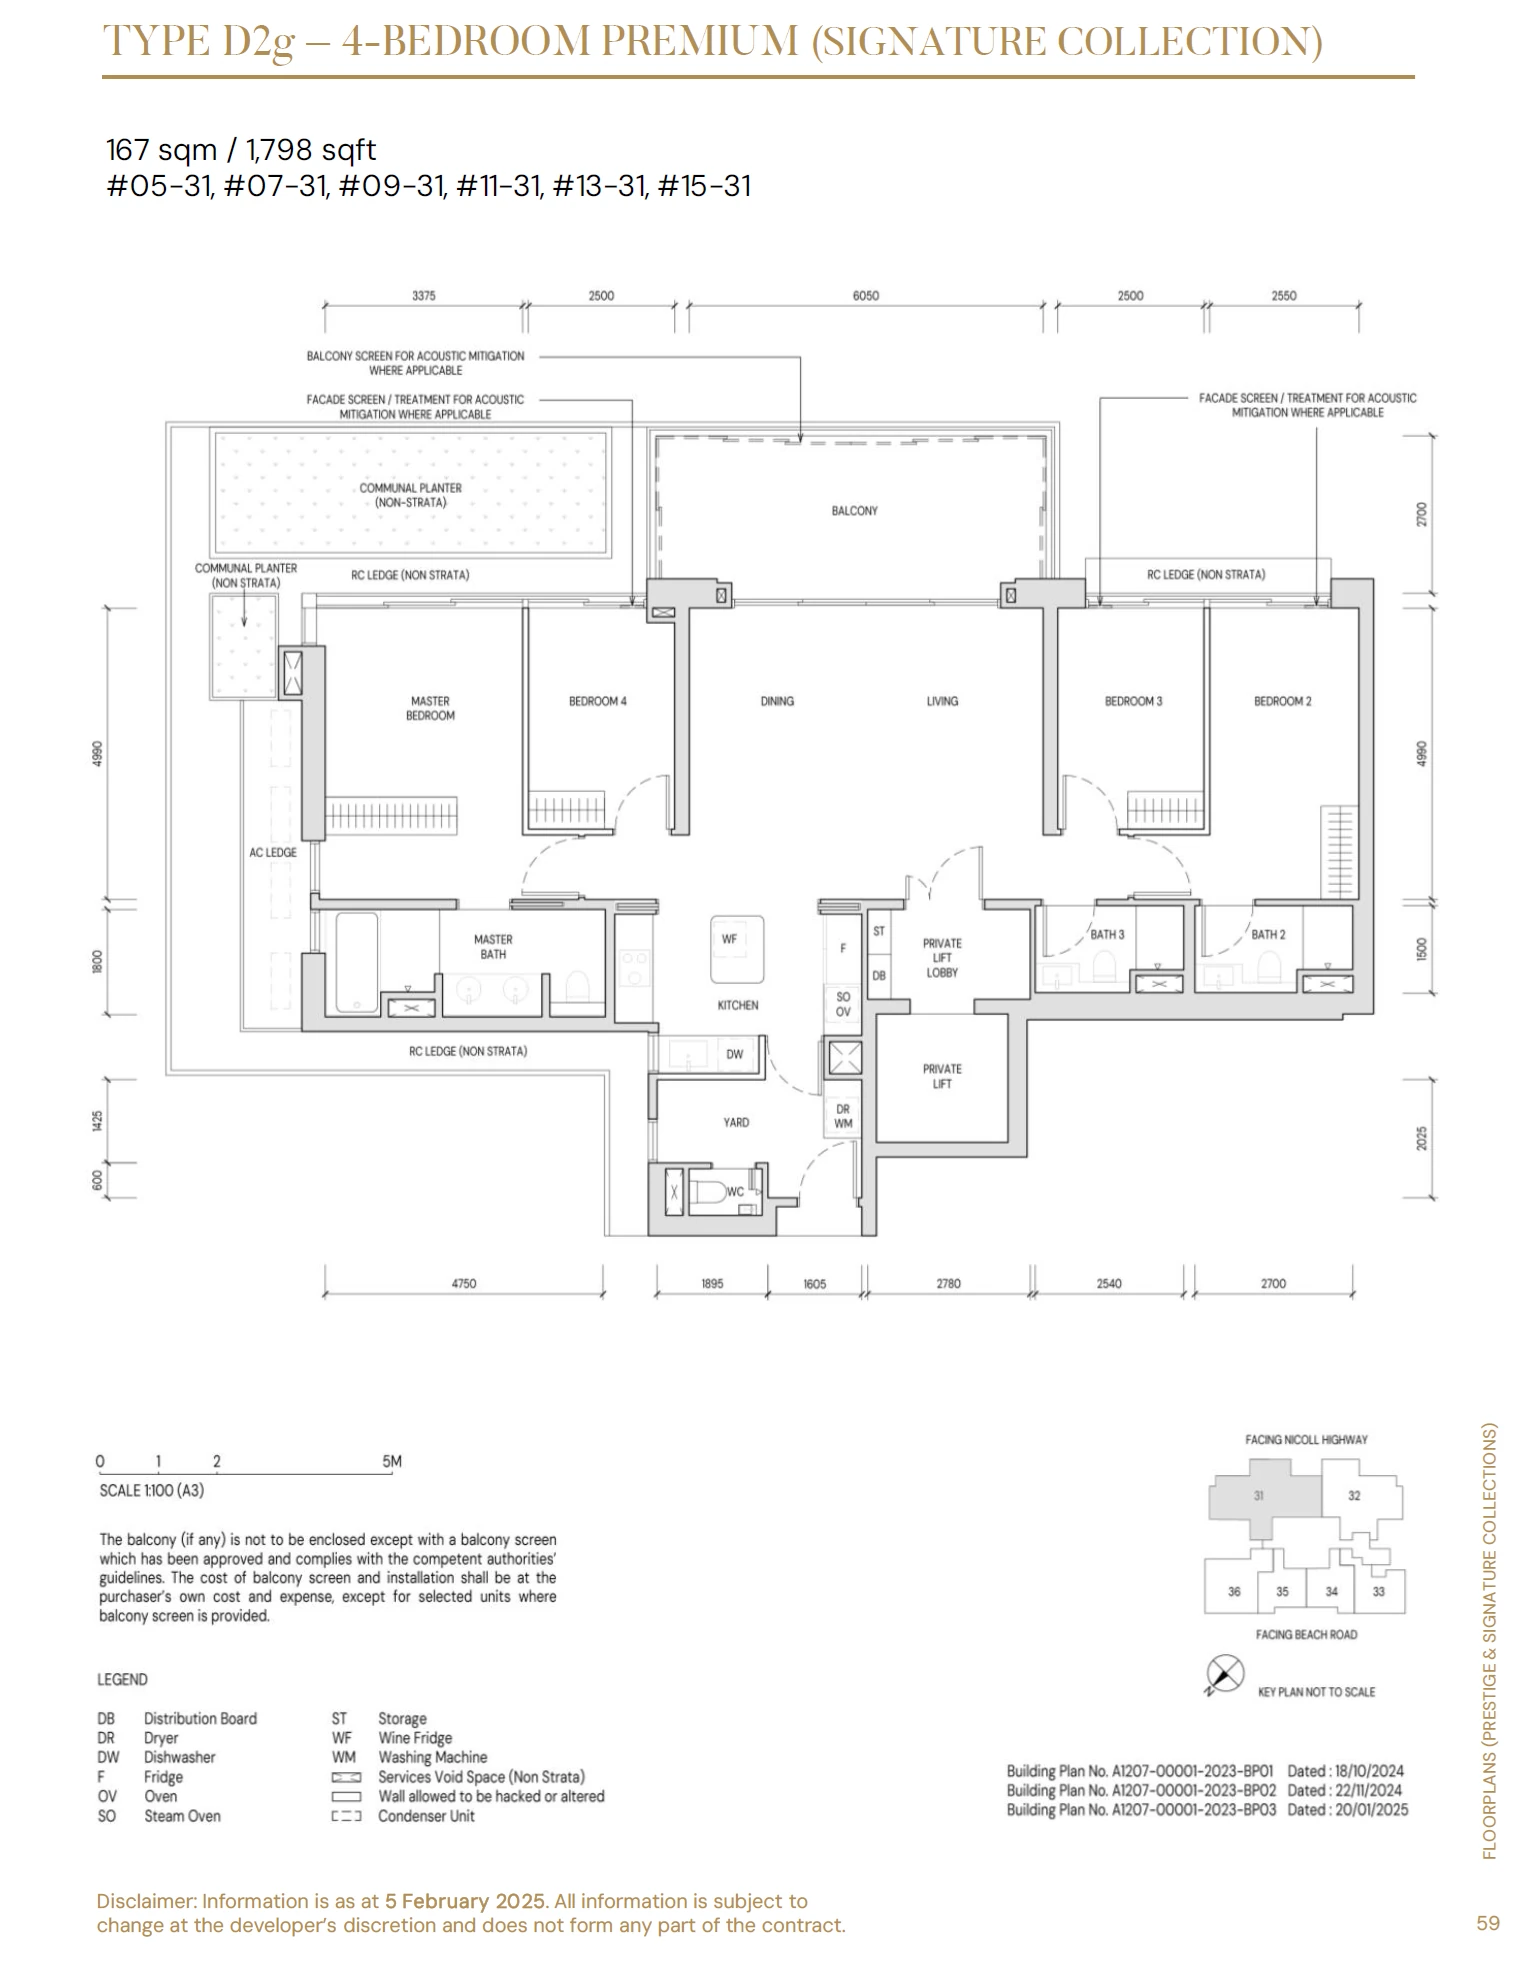
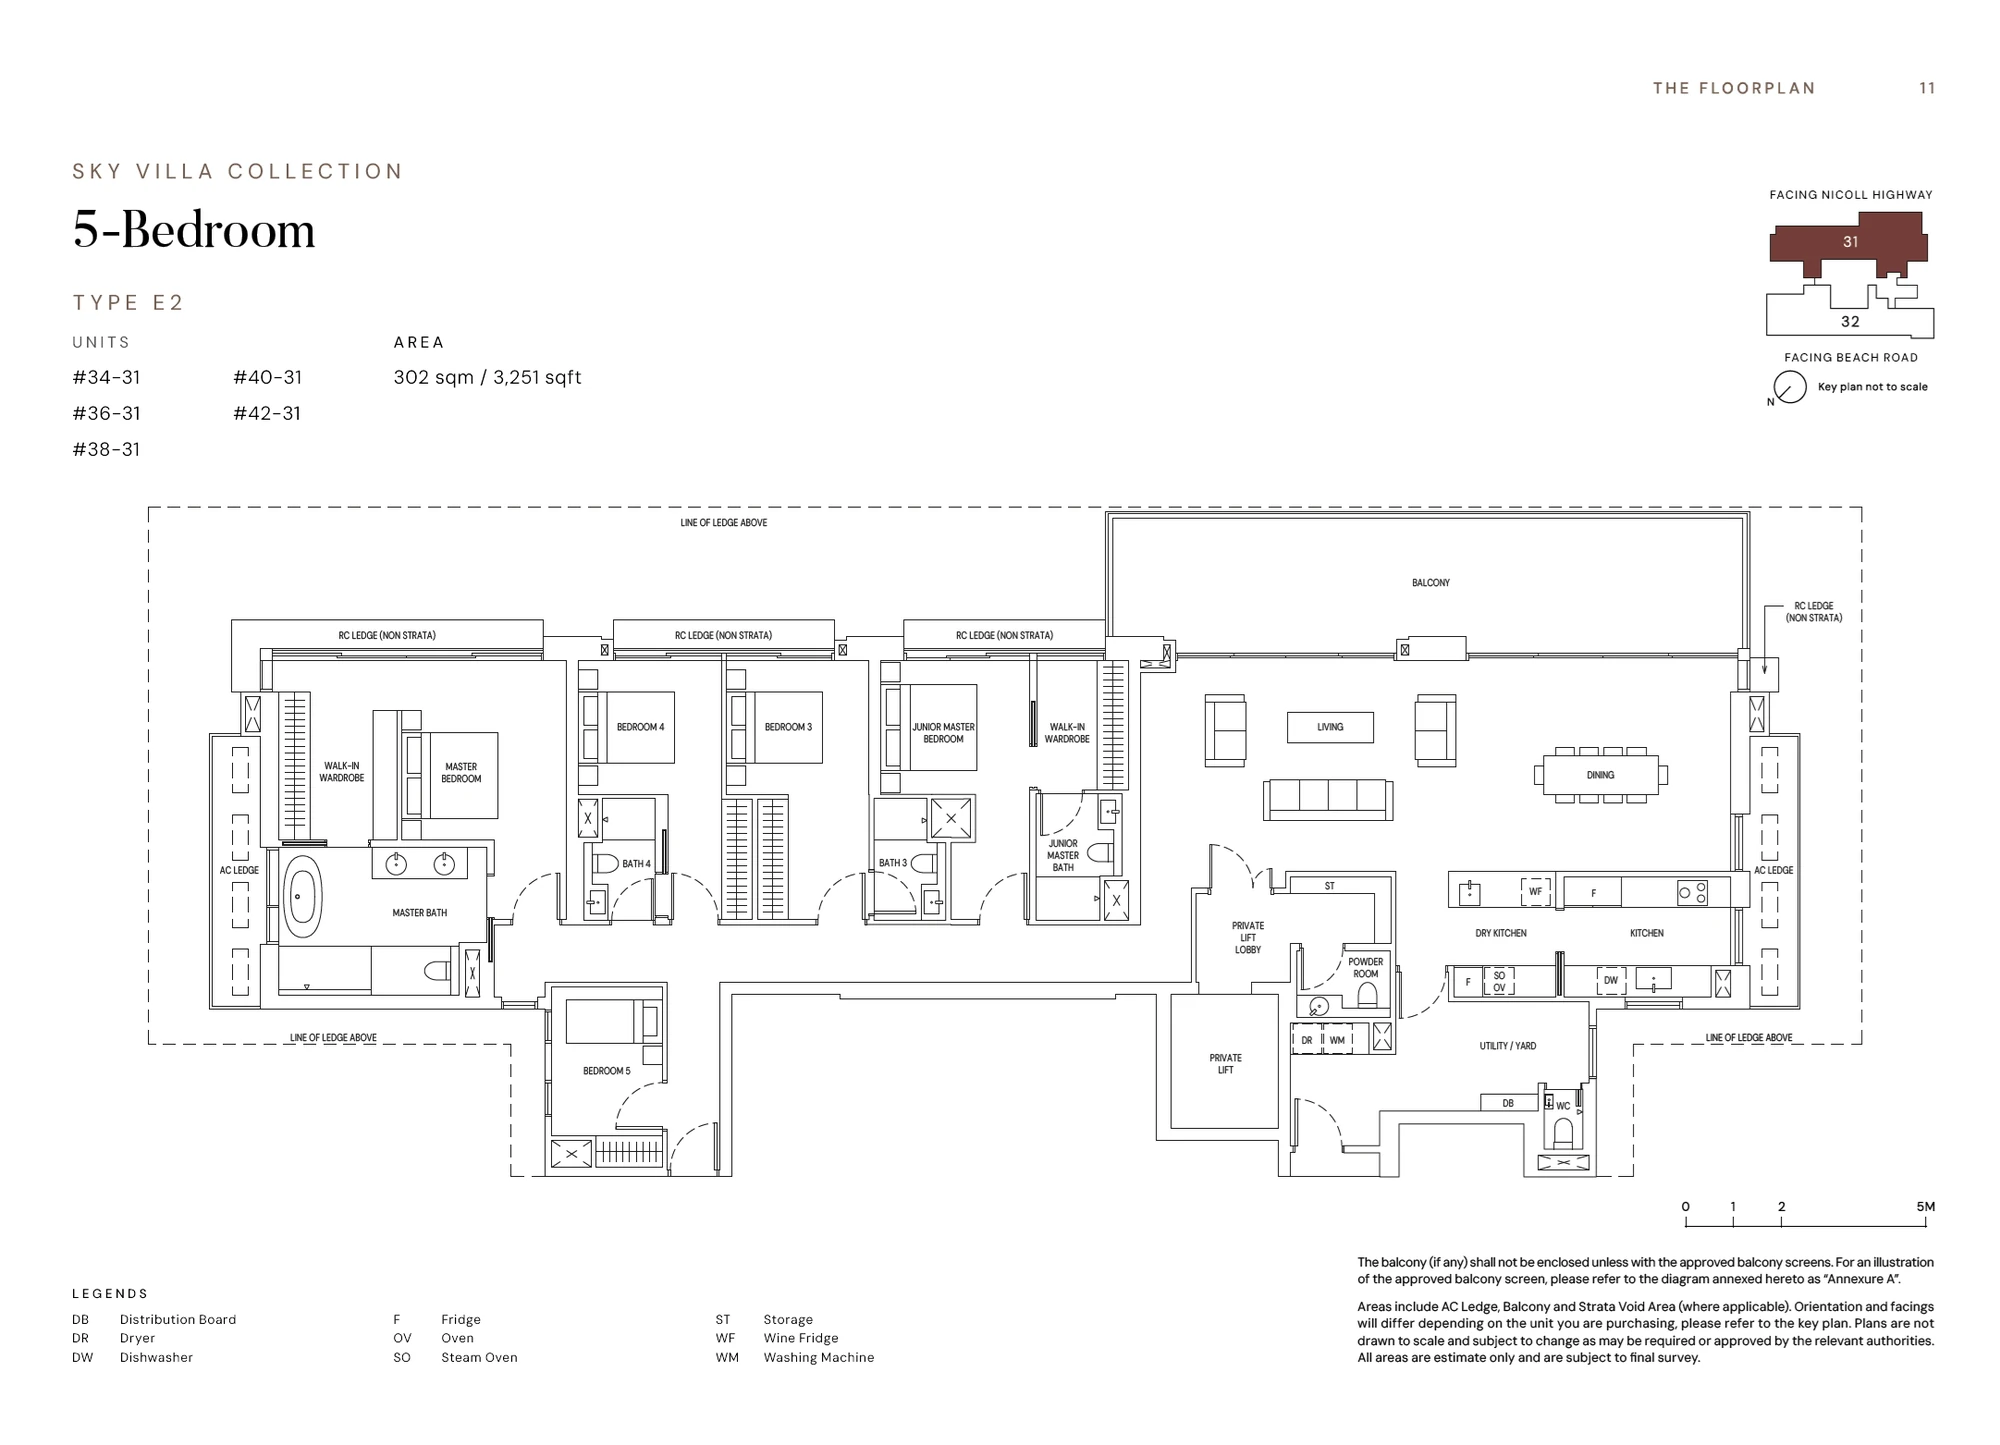
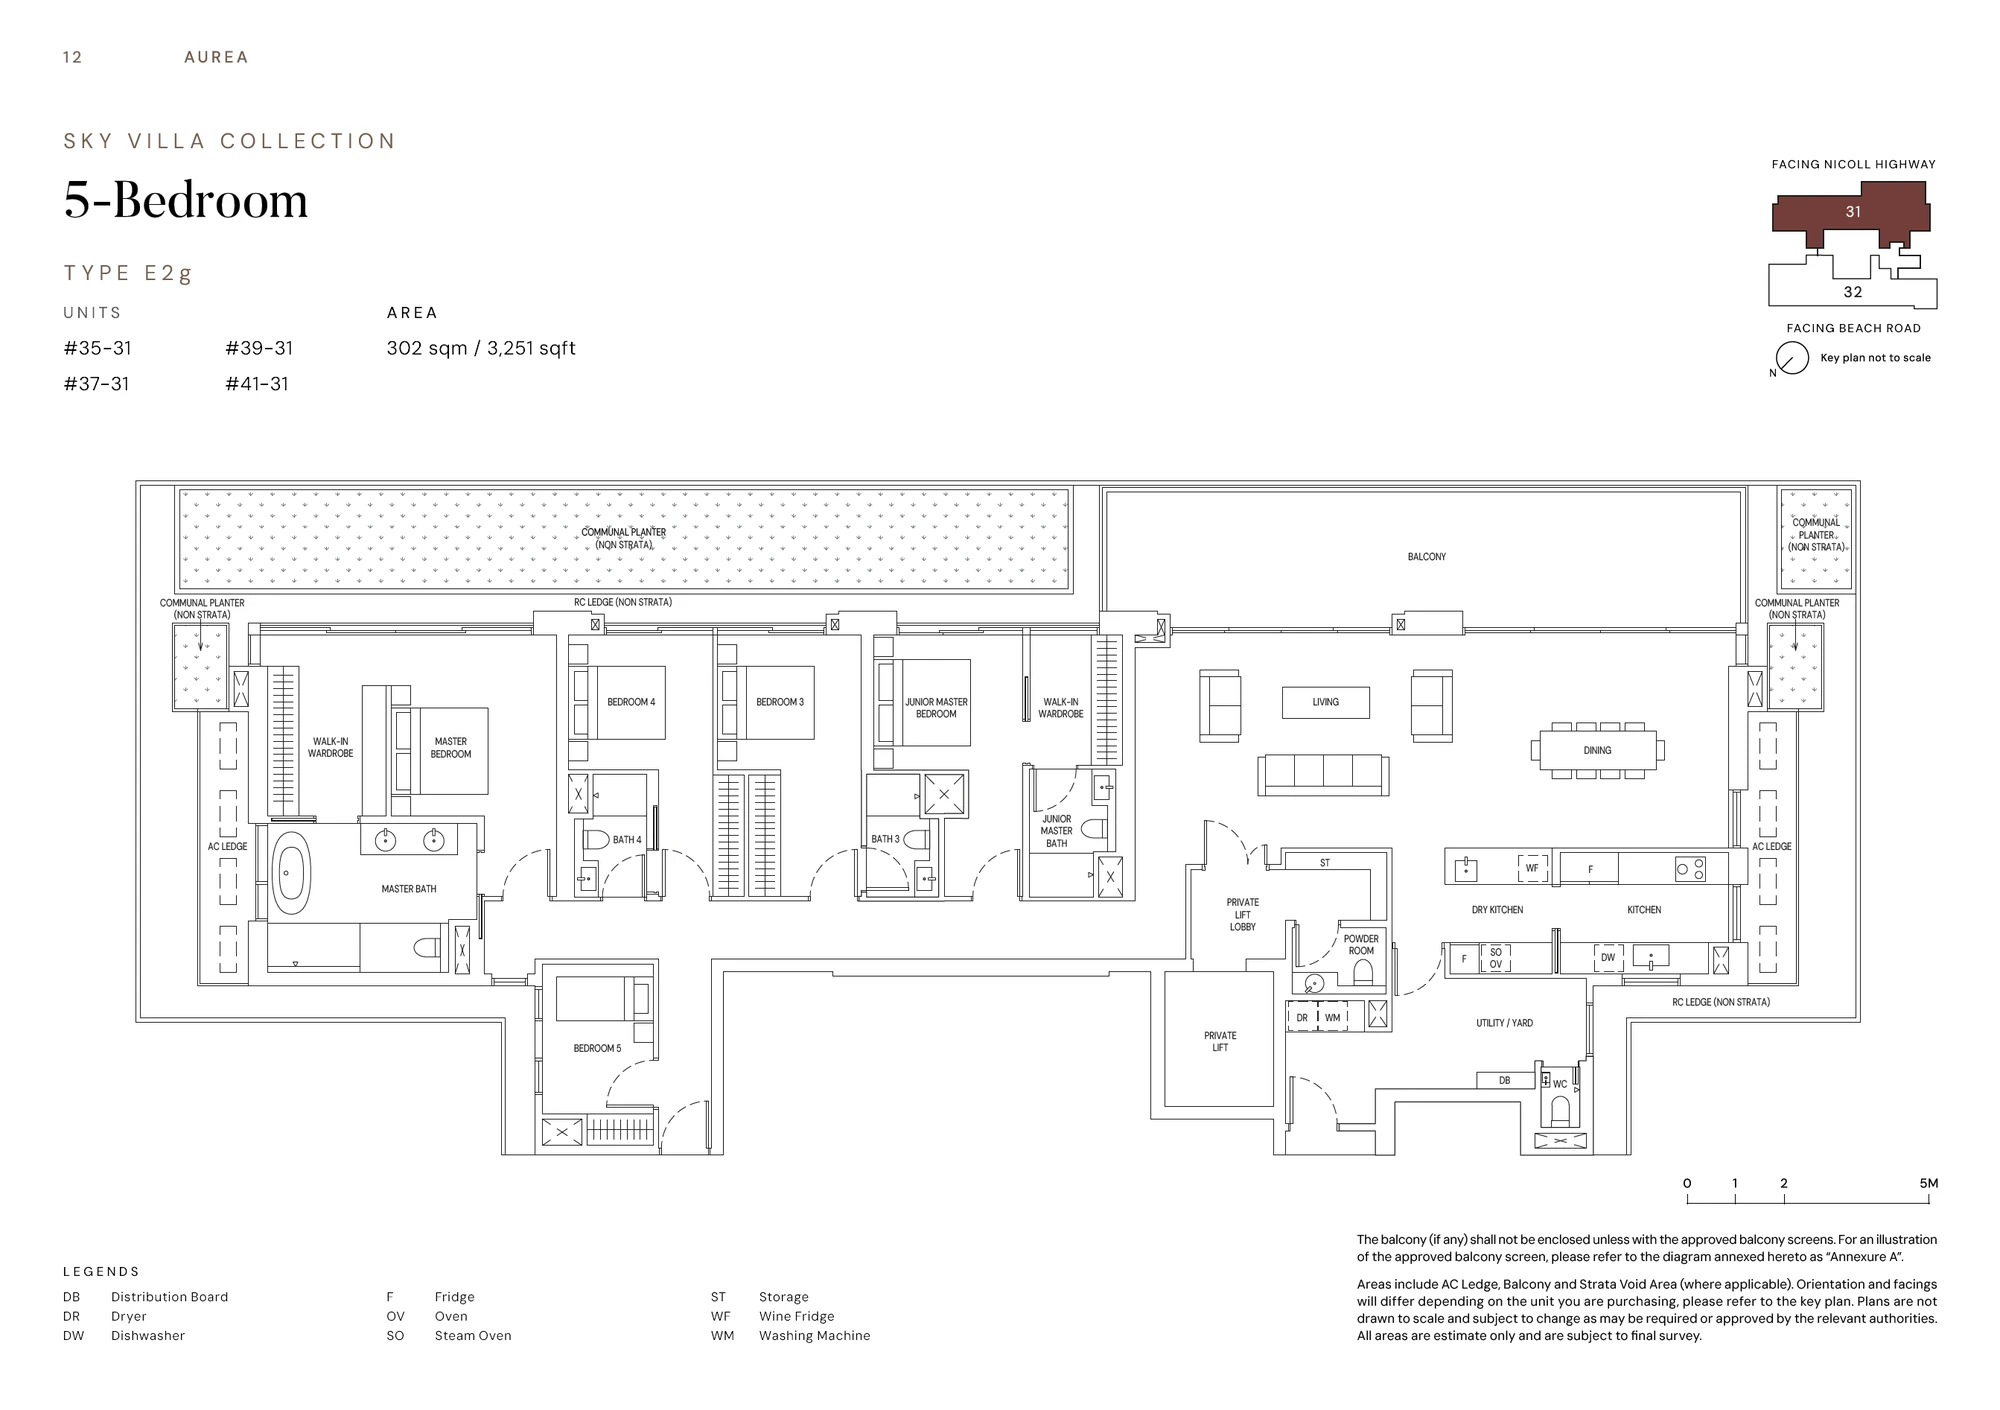
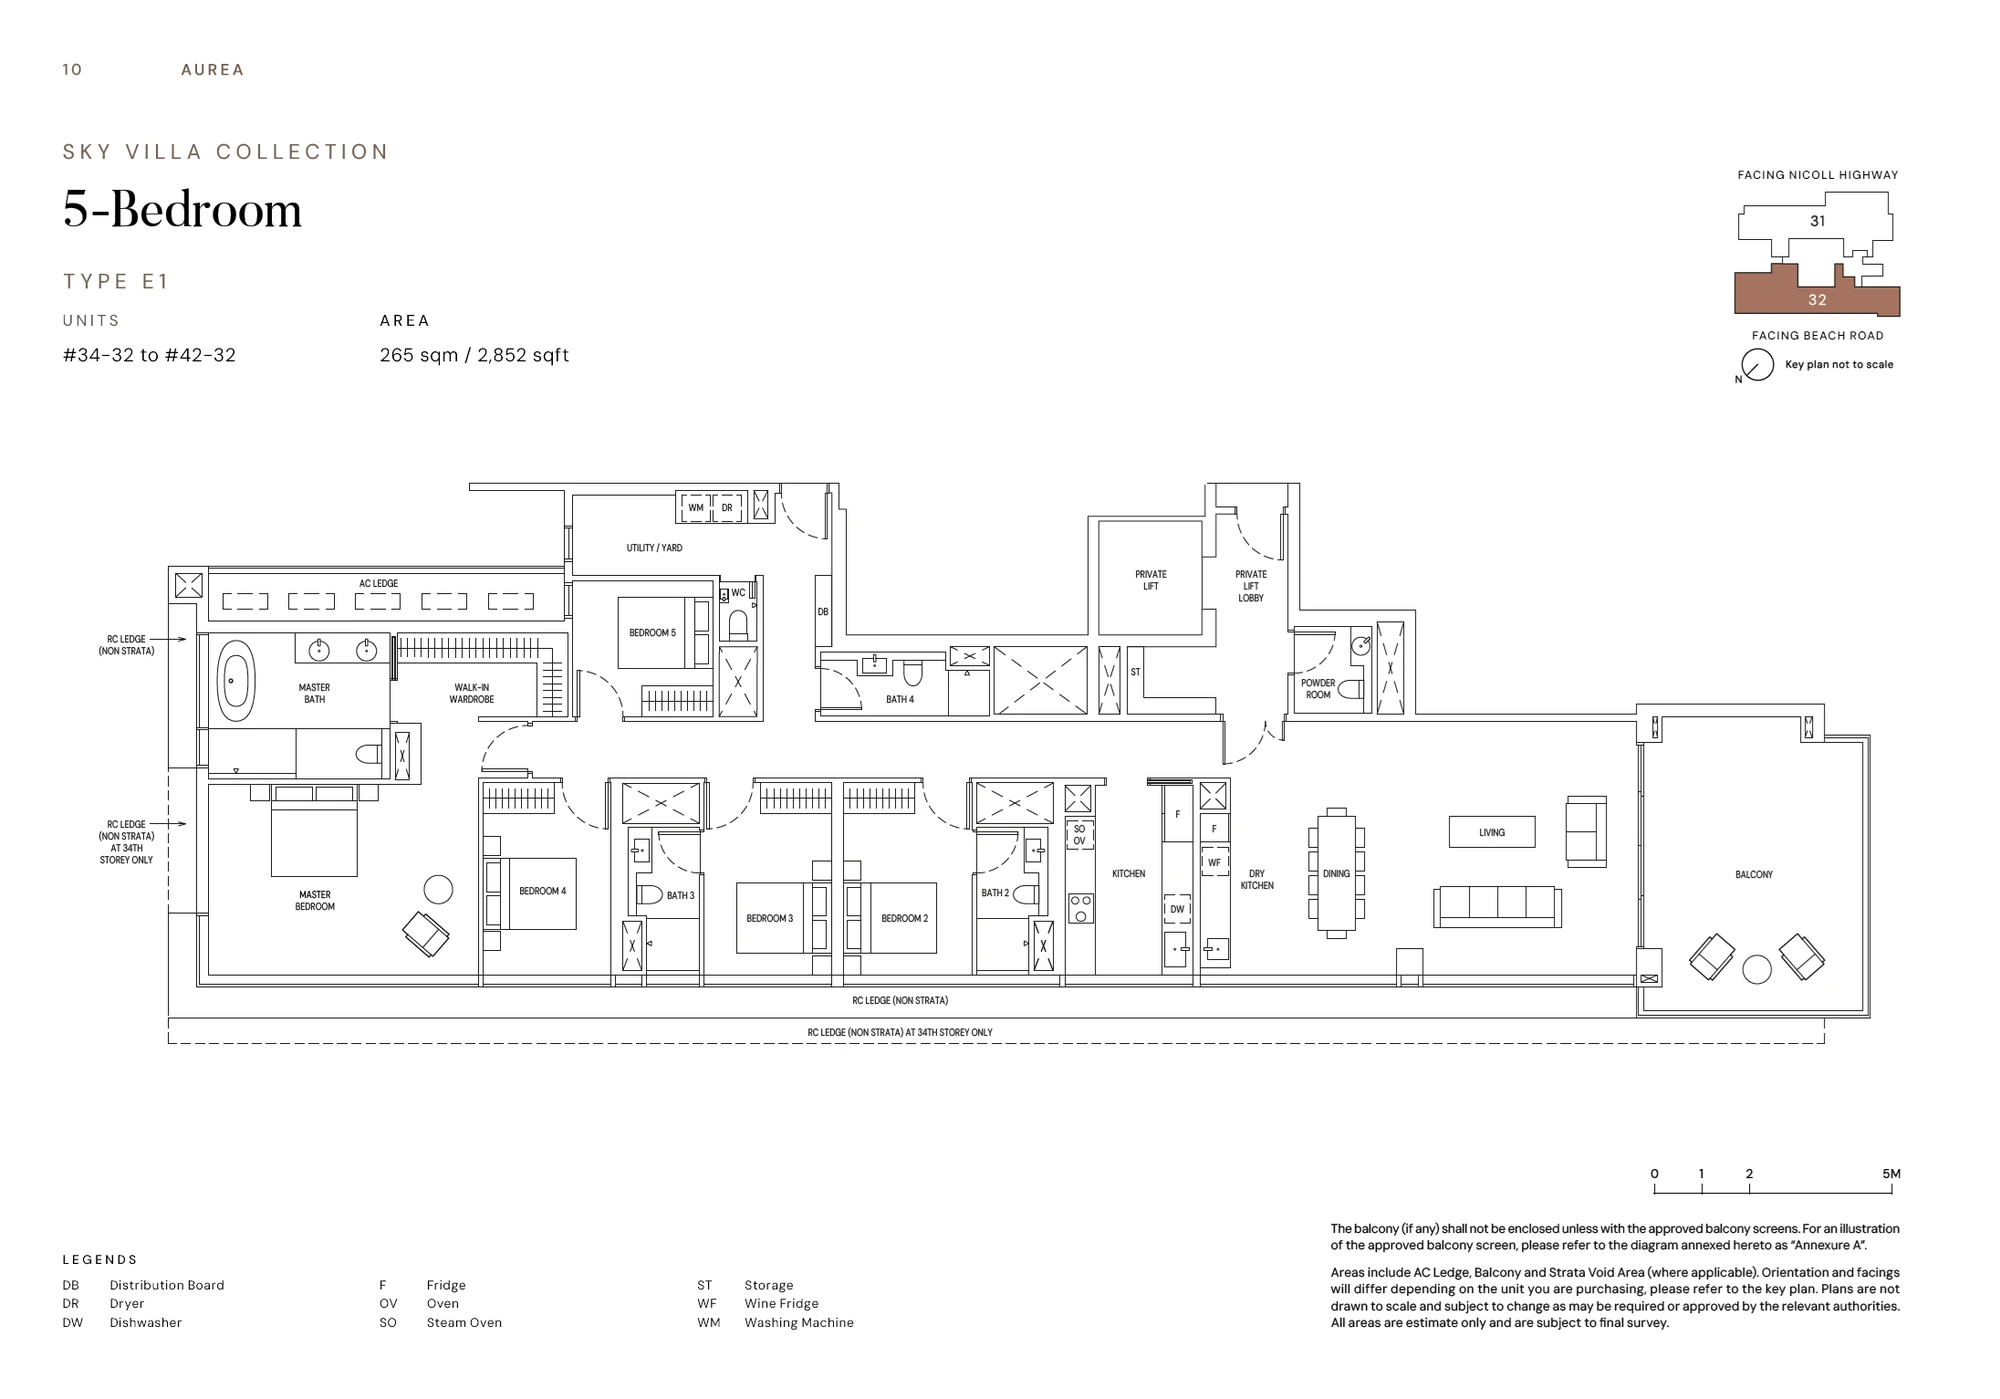
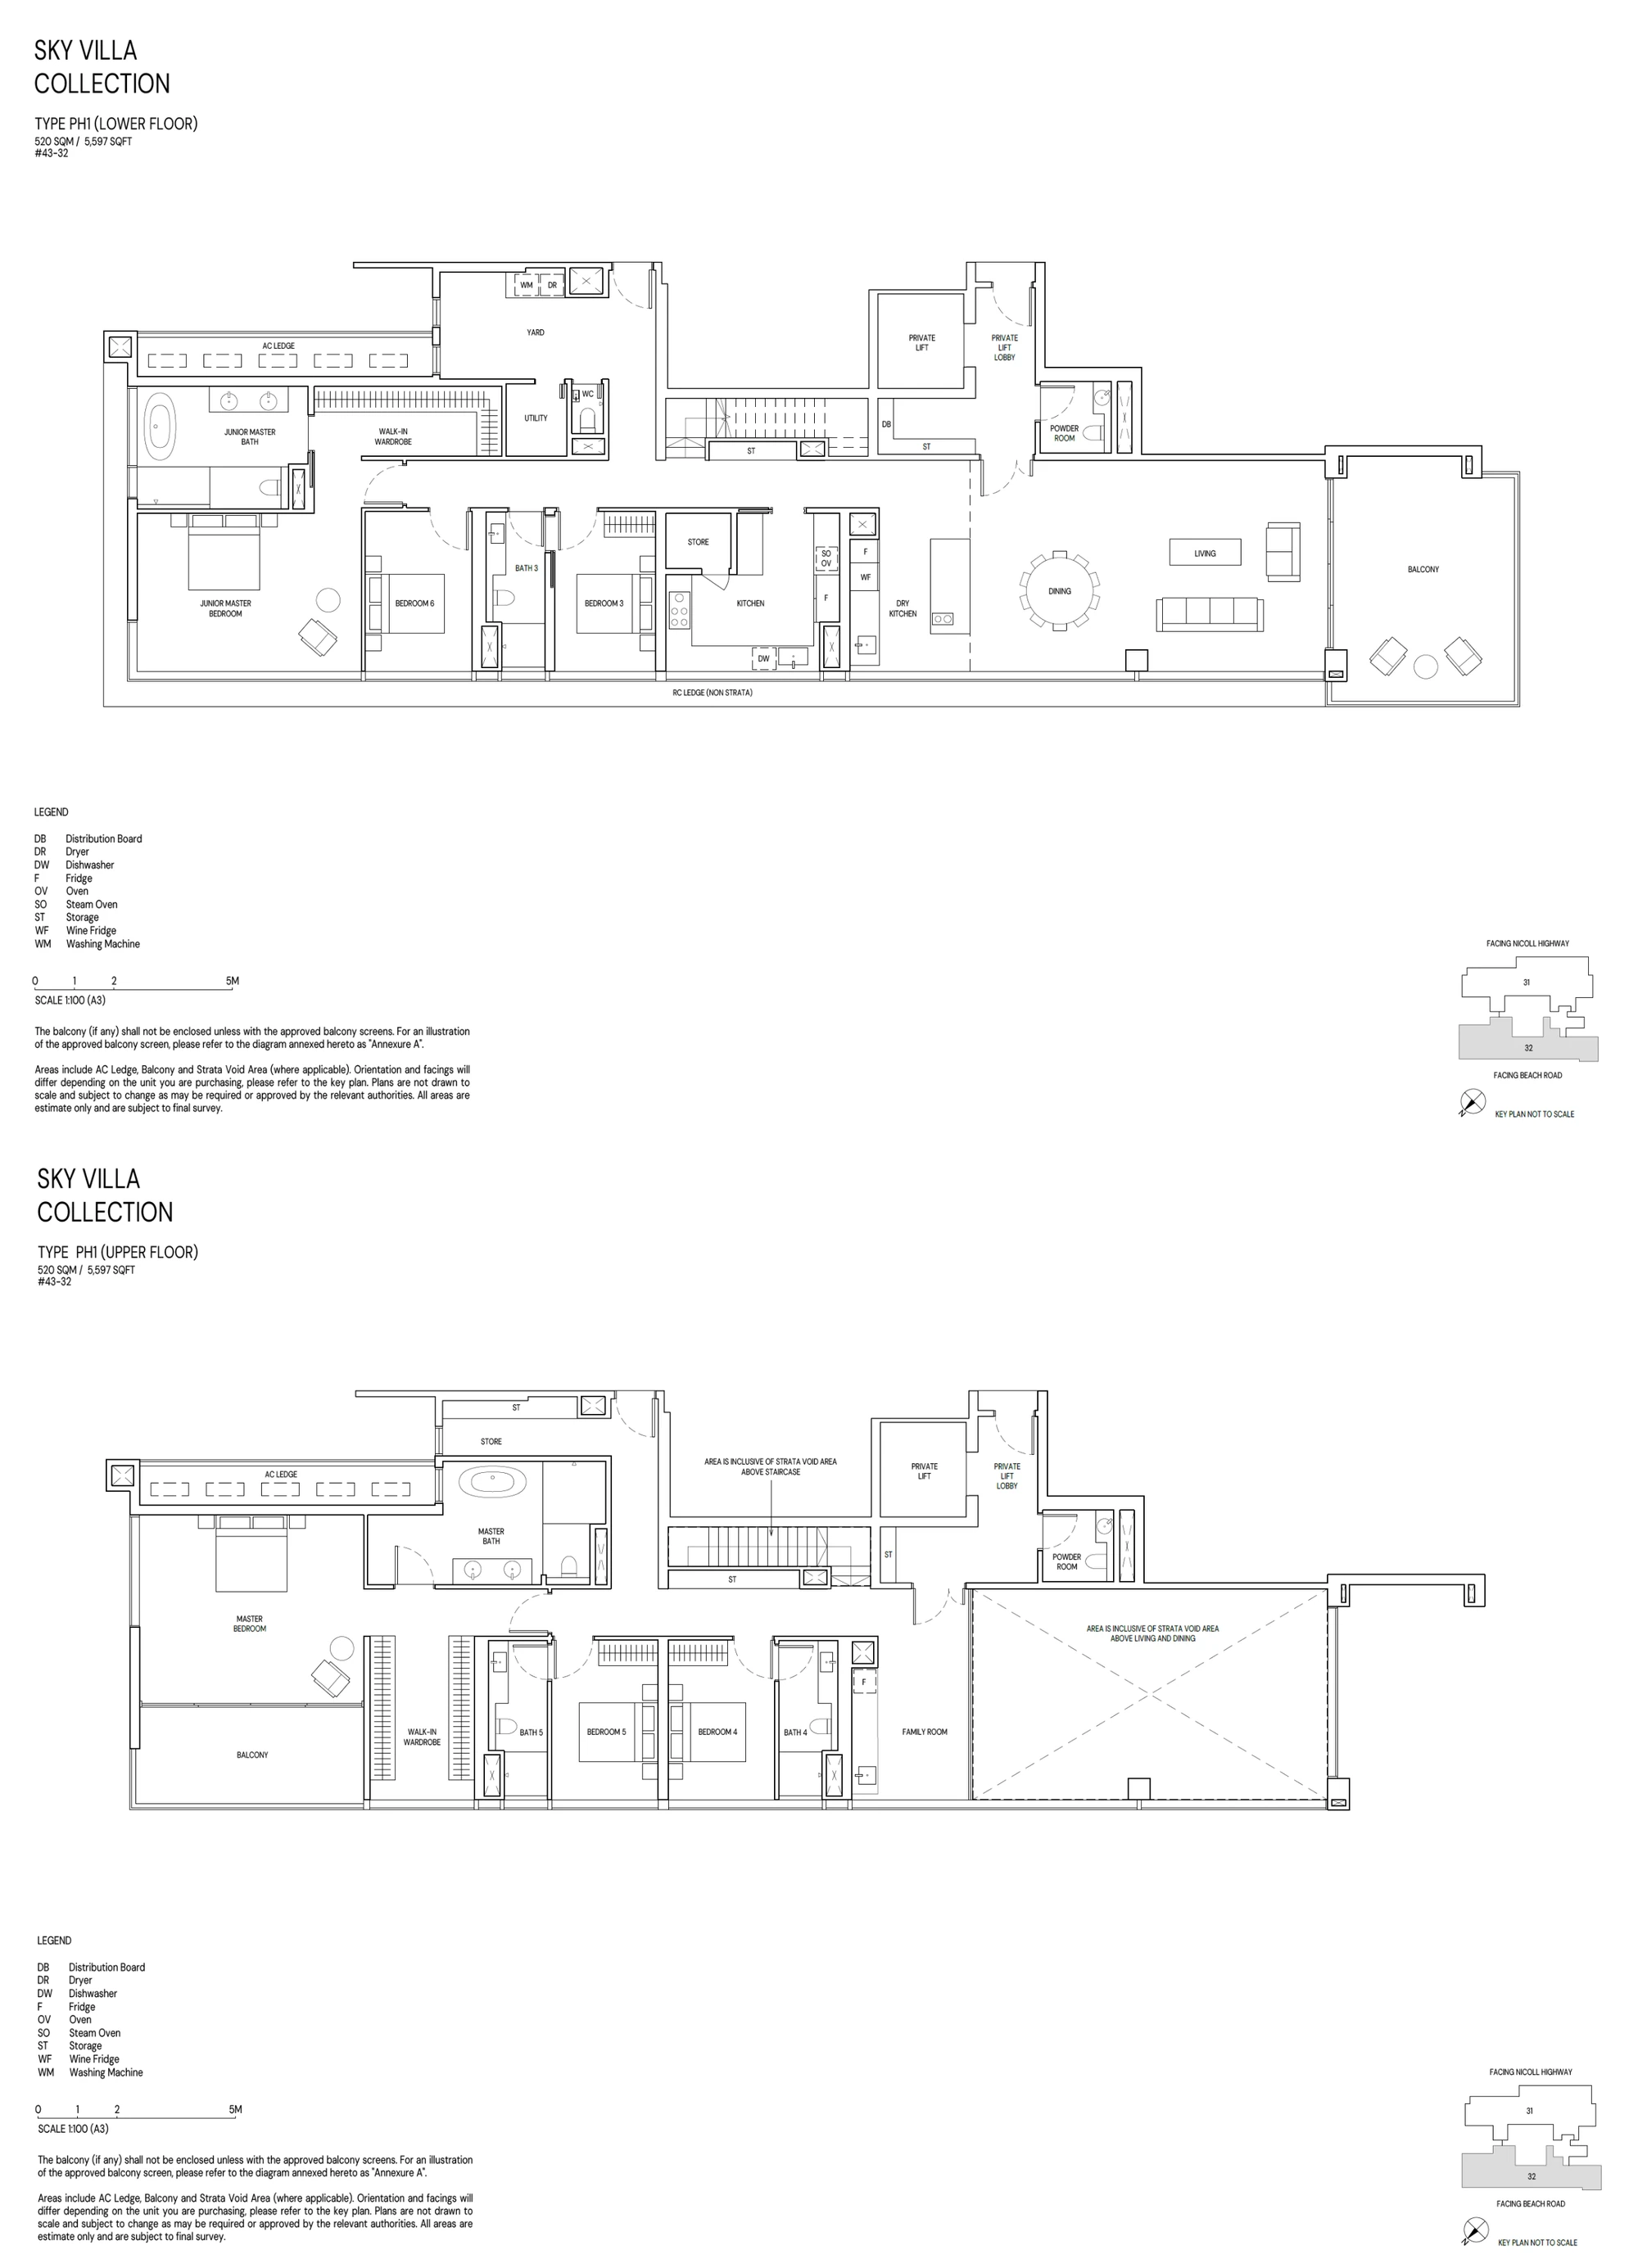
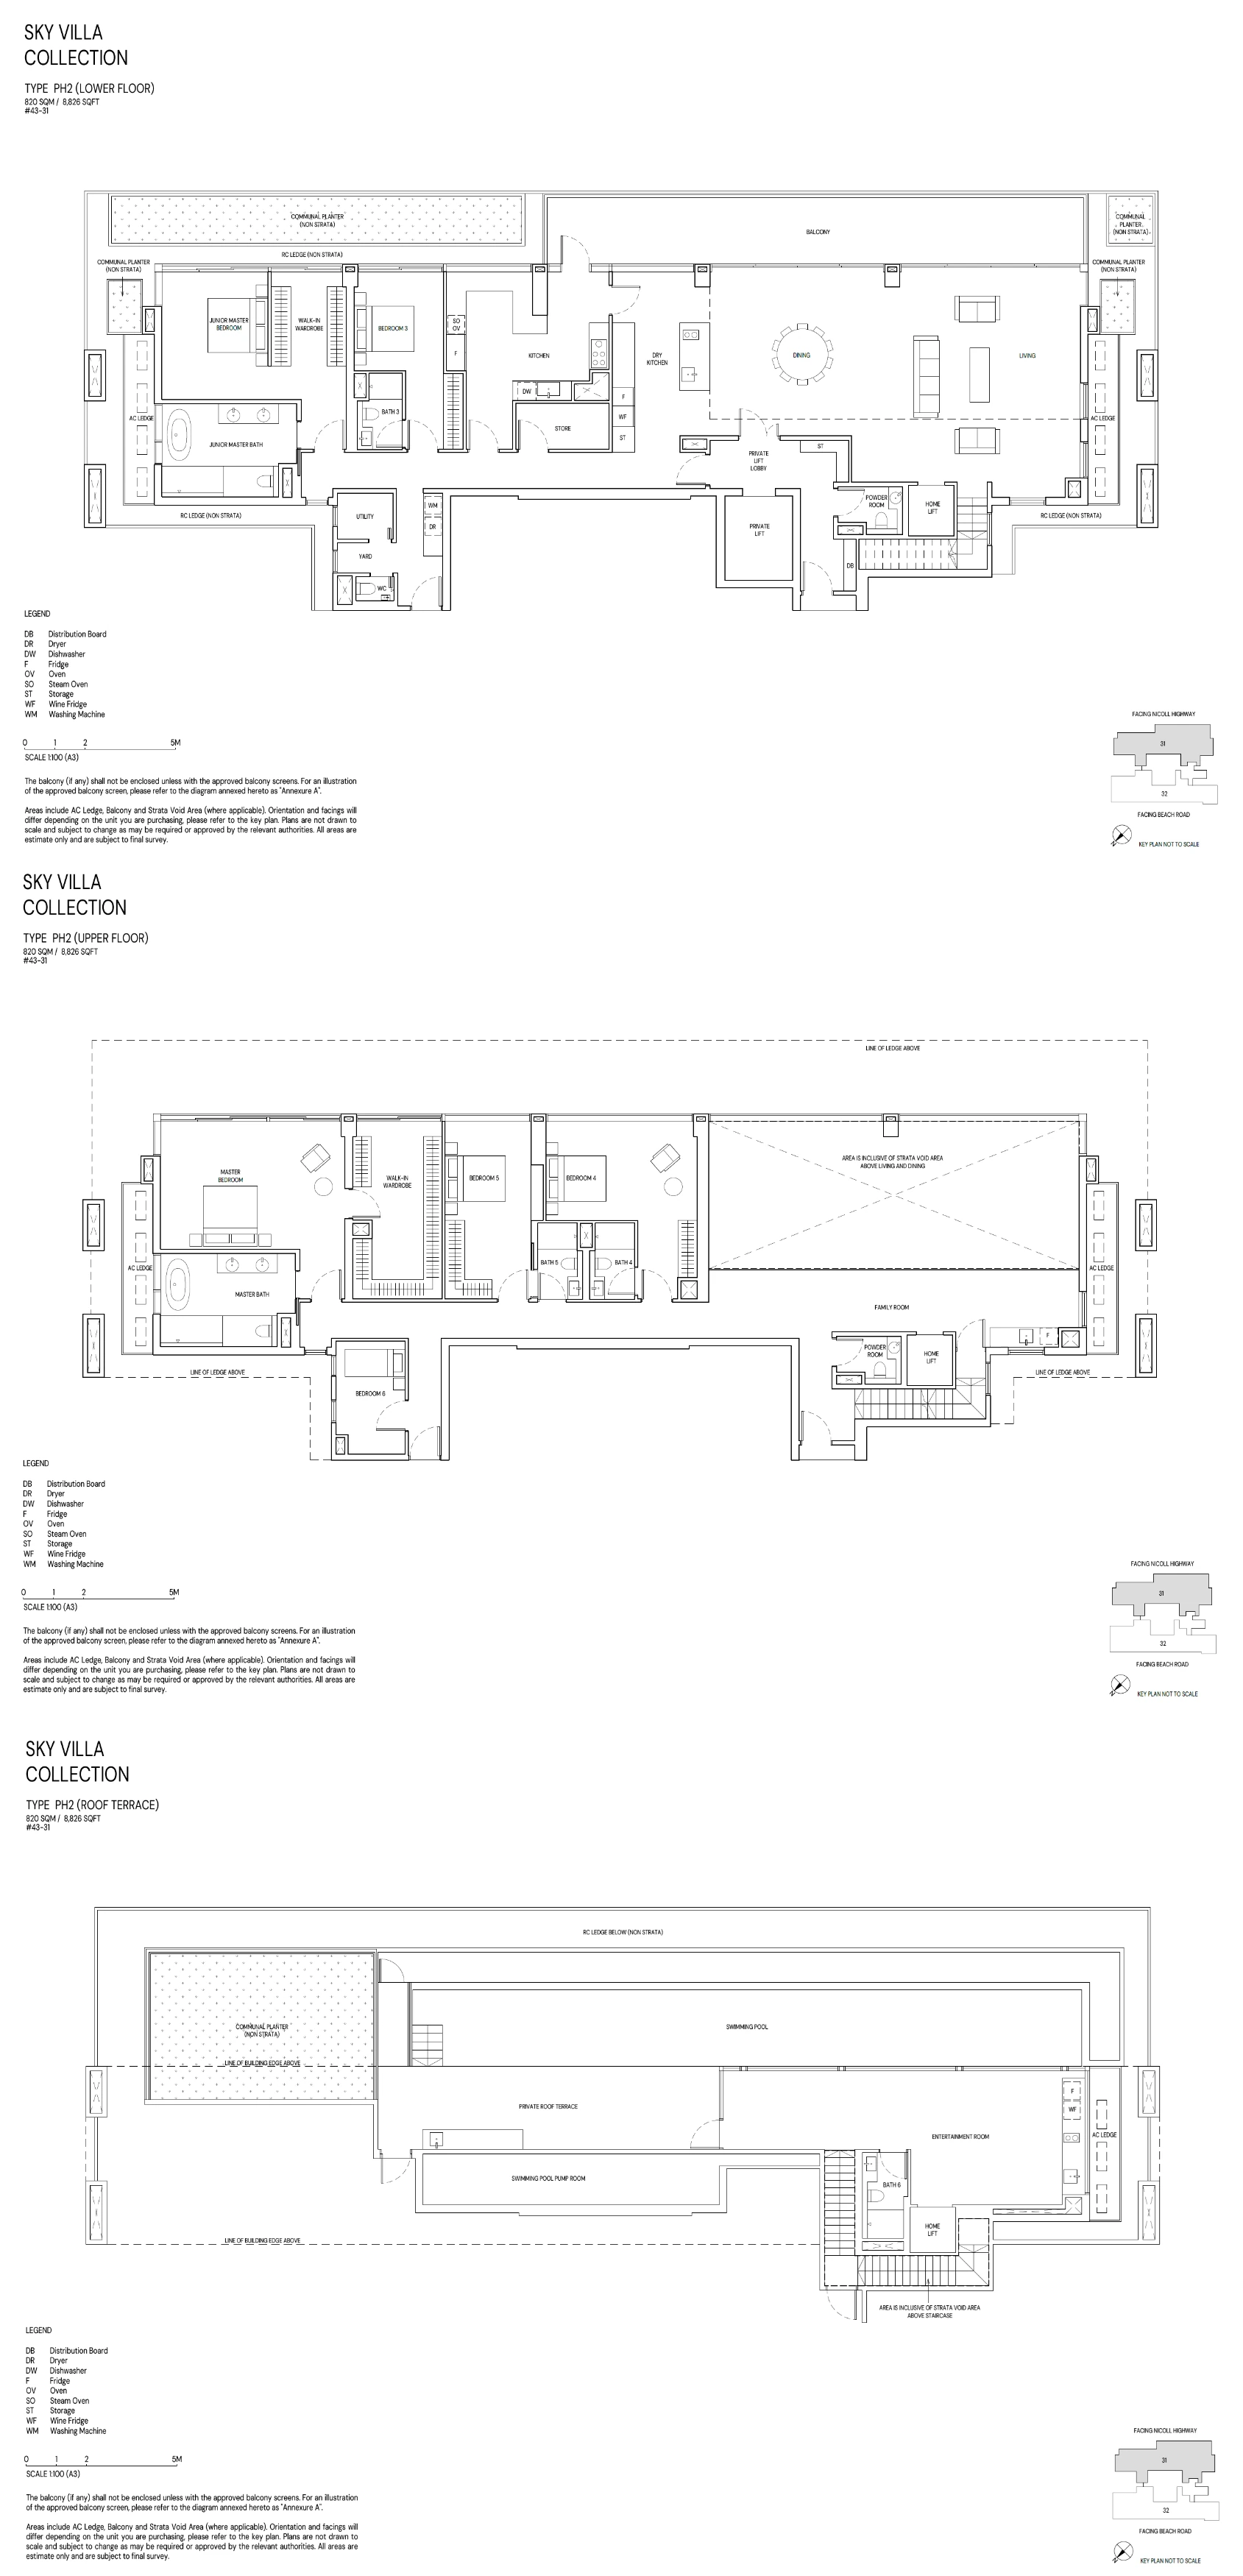
Plans are illustrative. Refer to the developer’s sale documents for dimensions and specifications.
Layout sizes
Browse the home types and floor areas. Availability is listed separately under units and prices.
| Type | Bedrooms | Size (sq ft) | Category |
|---|---|---|---|
| B1 | 2 | 635 | Residential |
| B1H | 2 | 635 | Residential |
| B2 | 2 | 646 | Residential |
| B2H | 2 | 646 | Residential |
| B3 | 2 | 710 | Residential |
| B3H | 2 | 710 | Residential |
| C1 | 3 | 1,001 | Residential |
| C1H | 3 | 1,001 | Residential |
| D1 | 4 | 1,442 | Residential |
| D1g | 4 | 1,442 | Residential |
| D1H | 4 | 1,442 | Residential |
| D1Hg | 4 | 1,442 | Residential |
| D2 | 4 | 1,798 | Residential |
| D2g | 4 | 1,798 | Residential |
| D2H | 4 | 1,798 | Residential |
| D2Hg | 4 | 1,798 | Residential |
| E1 | 5 | 2,863 | Residential |
| E2 | 5 | 3,251 | Residential |
| E2g | 5 | 3,251 | Residential |
| PH1 | 6 | 5,608 | Residential |
| PH2 | 6 | 8,816 | Residential |
Areas may include balconies, terraces or other spaces. Refer to the developer’s plans for the exact layout and area definitions.
Recorded property transactions
Rental rates and contracts
Explore completed transactions alongside the launch asking prices and availability above.
Rental rates by home type
No matched rental contracts are available for this property in this dataset.
Monthly rental price per square foot is an interval calculated from the source area band. Open-ended or missing area bands do not produce an exact rental PSF. These completed contracts are separate from advertised asking rents.
Recorded transactions: URA property data.
Sun & shadows
FindSpace Property Fundamentals
Grade C · 62.15 / 100
| Factor | Points | Basis |
|---|---|---|
| Relative price | 6.84 / 20 | Relative median PSF within the named peer cohort. Lower price can reflect property differences and does not establish undervaluation. National peer group: location differences affect prices. PSF uses source-recorded area, not a harmonised common measurement regime; included spaces and area rules may differ. |
| Recorded-price trend | 12.54 / 15 | Change in consecutive annual cohort median PSF. The mix of properties sold can change; this is not a capital-appreciation forecast. National cohort trend; this is not a local neighbourhood trend. Changes in area measurement regimes can also affect recorded PSF. |
| Transaction activity | 5.26 / 20 | Recorded annual transaction count within the peer cohort, not sales probability. Larger developments can record more trades. National peer group: location differences affect prices. |
| Rail access | 15.82 / 20 | Closest eligible recorded rail point within 2 km: Nicoll Highway. Straight-line distance from approximate source points, not a walking route. The source extract may not contain every nearby feature. |
| Everyday amenities | 7.09 / 10 | Mean distance to the closest recorded supermarket, healthcare and park points, each within 1.5 km. Historical source extract, not a complete national amenity inventory; straight-line distances are not walking routes. |
| Tenure | 14.60 / 15 | Remaining years calculated from the stated lease term and commencement year at September 2026; commencement month is unavailable. |
The same factors, weights and grade bands apply across new launches, private resale, landed and HDB. Recorded evidence is not a valuation or forecast.
Open the research, cohort details and redevelopment evidence →