
Meyer Blue
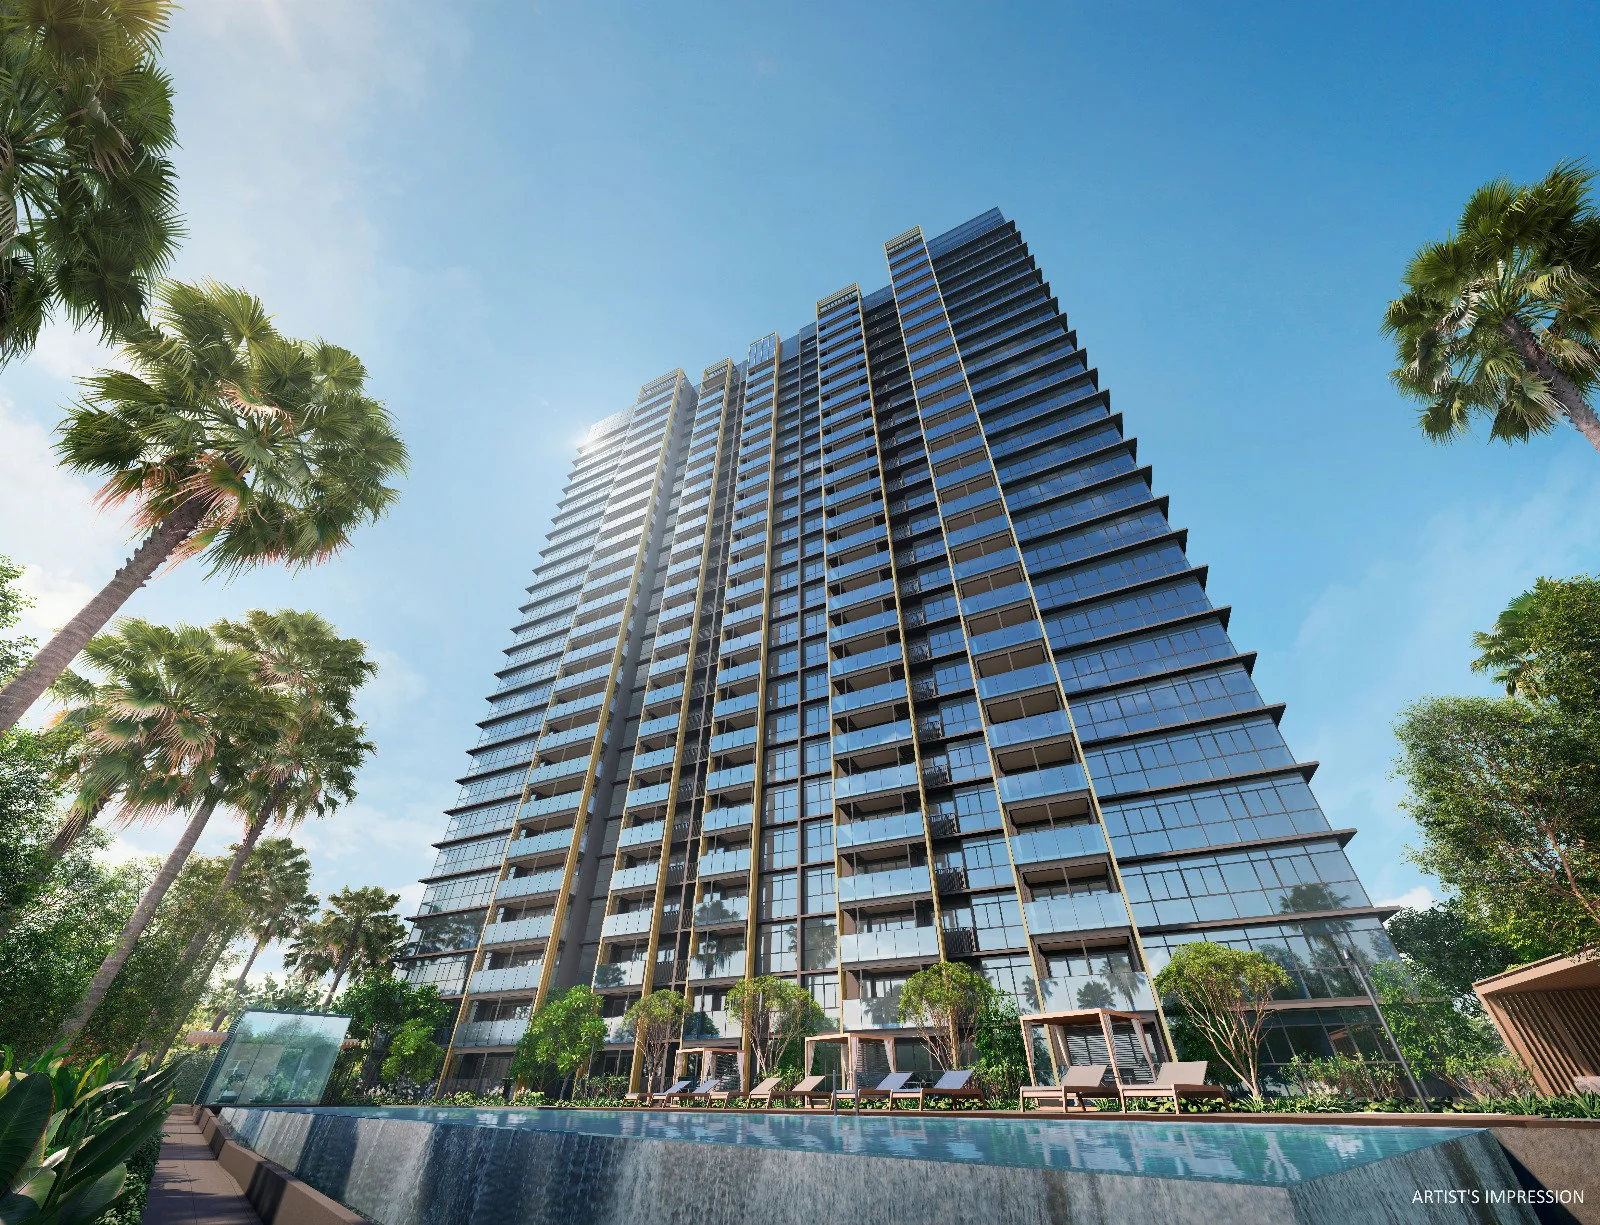
D15 · Freehold
Explore Meyer Blue at Meyer Road, with project details, nearby amenities and home layouts.
- Location
- Meyer Road
- District
- D15
- Developer
- UOL Group Limited & Singapore Land Group
- Tenure
- Freehold
- Project units
- 226
Location & nearby places
Approximate location: Approximate historical project location. Interactive map requires JavaScript and map tiles to load.
Approximate project position, not a surveyed boundary or an entrance. Source
Previously recorded OneMap project address point; not a surveyed project centroid or boundary
- Hawaii TowerBus stopsApproximately 131 m straight-line distanceSource
- Carpark B1Bus stopsApproximately 164 m straight-line distanceSource
- The SovereignBus stopsApproximately 211 m straight-line distanceSource
- Meyer Road PlaygroundParksApproximately 358 m straight-line distanceSource
- Katong ParkParksApproximately 594 m straight-line distanceSource
- Katong ParkRail stationsApproximately 627 m straight-line distanceSource
- Tanjong KatongRail stationsApproximately 716 m straight-line distanceSource
- EtonHouse Nature Pre-SchoolPreschoolsApproximately 721 m straight-line distanceSource
- Odyssey The Global PreschoolPreschoolsApproximately 756 m straight-line distanceSource
- KiddiWinkie SchoolhousePreschoolsApproximately 777 m straight-line distanceSource
- Wilkinson Interim ParkParksApproximately 794 m straight-line distanceSource
- Old Town White CoffeeFood & drinkApproximately 849 m straight-line distanceSource
- Food SplashFood & drinkApproximately 871 m straight-line distanceSource
- Kimchi BoxFood & drinkApproximately 878 m straight-line distanceSource
- Oliver Dental SurgeryHealthcareApproximately 1,194 m straight-line distanceSource
- Chan Family ClinicHealthcareApproximately 1,252 m straight-line distanceSource
- Glory Dental SurgeryHealthcareApproximately 1,272 m straight-line distanceSource
- Katong Shopping CentreMalls & marketsApproximately 1,331 m straight-line distanceSource
- DakotaRail stationsApproximately 1,361 m straight-line distanceSource
- Tanjong Katong Primary SchoolSchoolsApproximately 1,377 m straight-line distanceSource
- FairPriceSupermarketsApproximately 1,450 m straight-line distanceSource
- Odeon Katong Shopping ComplexMalls & marketsApproximately 1,450 m straight-line distanceSource
- Old Airport Road Food Centre & Shopping MallMalls & marketsApproximately 1,456 m straight-line distanceSource
- FairPrice FinestSupermarketsApproximately 1,481 m straight-line distanceSource
Nearby places are selected reference points, not a complete amenity directory. Distances are approximate, not walking routes or school-admission eligibility.
Amenity data © OpenStreetMap contributors, available under ODbL 1.0. View source data.
Units & asking prices in snapshot
Source · Checked
Dated snapshot, not a live feed. Availability may have changed since the check above.
| Bedroom / type | Area shown (sq ft) | Units in snapshot | Asking price from | Asking price / sq ft |
|---|---|---|---|---|
| 3BR PremiumResidential | 1,141 sqft | — | S$3,505,000 | S$3,071.87Calculated from “Price From” ÷ the single area shown |
| 4BR Premium (w Private Lift)Residential | 1,518-1,528 sqft | — | S$4,528,000 | — |
| 4BR Premium + Study (w Private Lift)Residential | 1,733 sqft | — | S$5,338,000 | S$3,080.21Calculated from “Price From” ÷ the single area shown |
| 5BR Suite (w Private Lift)Residential | 1,905 sqft | — | S$5,780,000 | S$3,034.12Calculated from “Price From” ÷ the single area shown |
Provider asking prices and availability. “Price From” is a starting price for the displayed type, not an achieved sale price. Availability can change.
Ask FindSpace for the latest details ↗URA recorded transactions
Past sale transactions
Sales history: Oct 2021–Oct 2026
178 records · latest first
| Contract month | Sale type | Floor range | Area (sq ft) / basis | Sale price | Sale PSF | Units |
|---|---|---|---|---|---|---|
| Jul 2026 | New sale | 21-25 | 1,733.0 · Strata | S$5,752,000 | S$3,319.12 | 1 |
| Jun 2026 | New sale | 21-25 | 1,517.7 · Strata | S$5,209,000 | S$3,432.14 | 1 |
| Jun 2026 | New sale | 21-25 | 1,517.7 · Strata | S$5,139,000 | S$3,386.02 | 1 |
| May 2026 | New sale | 11-15 | 1,733.0 · Strata | S$5,573,000 | S$3,215.83 | 1 |
| May 2026 | New sale | 06-10 | 1,733.0 · Strata | S$5,460,000 | S$3,150.62 | 1 |
| May 2026 | New sale | 06-10 | 1,528.5 · Strata | S$4,757,000 | S$3,112.25 | 1 |
| Apr 2026 | New sale | 21-25 | 1,733.0 · Strata | S$5,797,000 | S$3,345.09 | 1 |
| Apr 2026 | New sale | 16-20 | 1,733.0 · Strata | S$5,707,000 | S$3,293.15 | 1 |
| Apr 2026 | New sale | 16-20 | 1,733.0 · Strata | S$5,662,000 | S$3,267.19 | 1 |
| Apr 2026 | New sale | 11-15 | 1,733.0 · Strata | S$5,528,000 | S$3,189.86 | 1 |
| Apr 2026 | New sale | 16-20 | 1,517.7 · Strata | S$4,959,000 | S$3,267.42 | 1 |
| Apr 2026 | New sale | 06-10 | 1,528.5 · Strata | S$4,777,000 | S$3,125.34 | 1 |
| Apr 2026 | New sale | 11-15 | 1,517.7 · Strata | S$4,753,000 | S$3,131.69 | 1 |
| Apr 2026 | New sale | 01-05 | 1,517.7 · Strata | S$4,559,000 | S$3,003.86 | 1 |
| Dec 2025 | New sale | 01-05 | 1,141.0 · Strata | S$3,529,000 | S$3,092.97 | 1 |
| Nov 2025 | New sale | 06-10 | 1,733.0 · Strata | S$5,423,000 | S$3,129.27 | 1 |
| Oct 2025 | New sale | 11-15 | 1,905.2 · Strata | S$5,908,000 | S$3,100.97 | 1 |
| Oct 2025 | New sale | 06-10 | 1,733.0 · Strata | S$5,378,000 | S$3,103.31 | 1 |
| Oct 2025 | New sale | 21-25 | 1,141.0 · Strata | S$3,812,000 | S$3,341.00 | 1 |
| Oct 2025 | New sale | 01-05 | 990.3 · Strata | S$3,001,000 | S$3,030.46 | 1 |
Sale prices use URA’s recorded price. PSF is calculated from that price and the reported strata or land area for single-unit sales. Multi-unit transactions show the total price and unit count. Recent records may be added or revised.
URA private residential property data. Calculations by FindSpace. Source · Singapore Open Data Licence
Floorplans & site plans
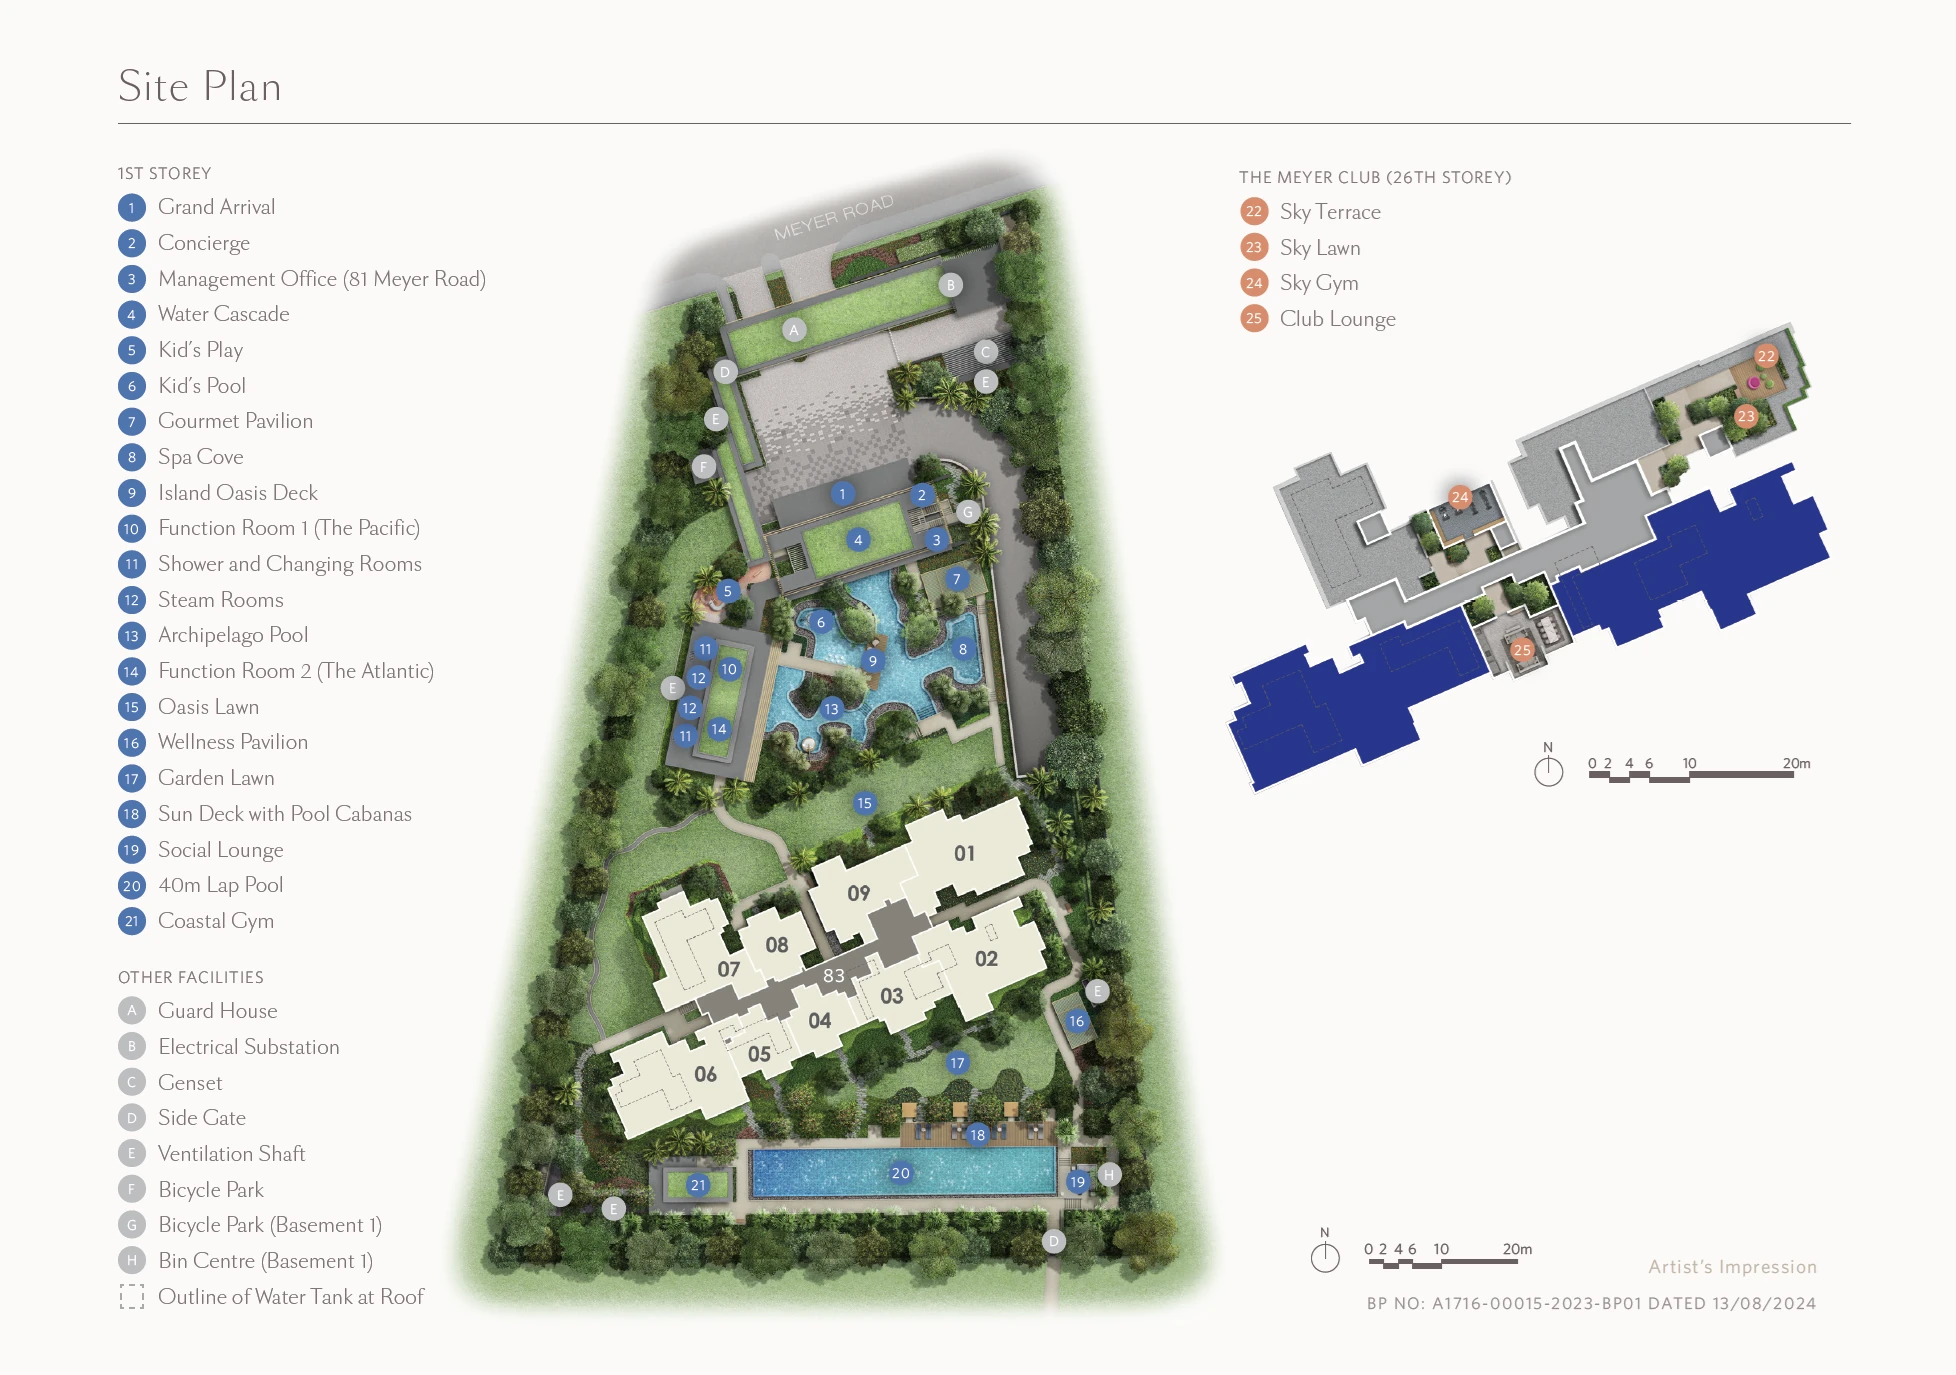
Site plan
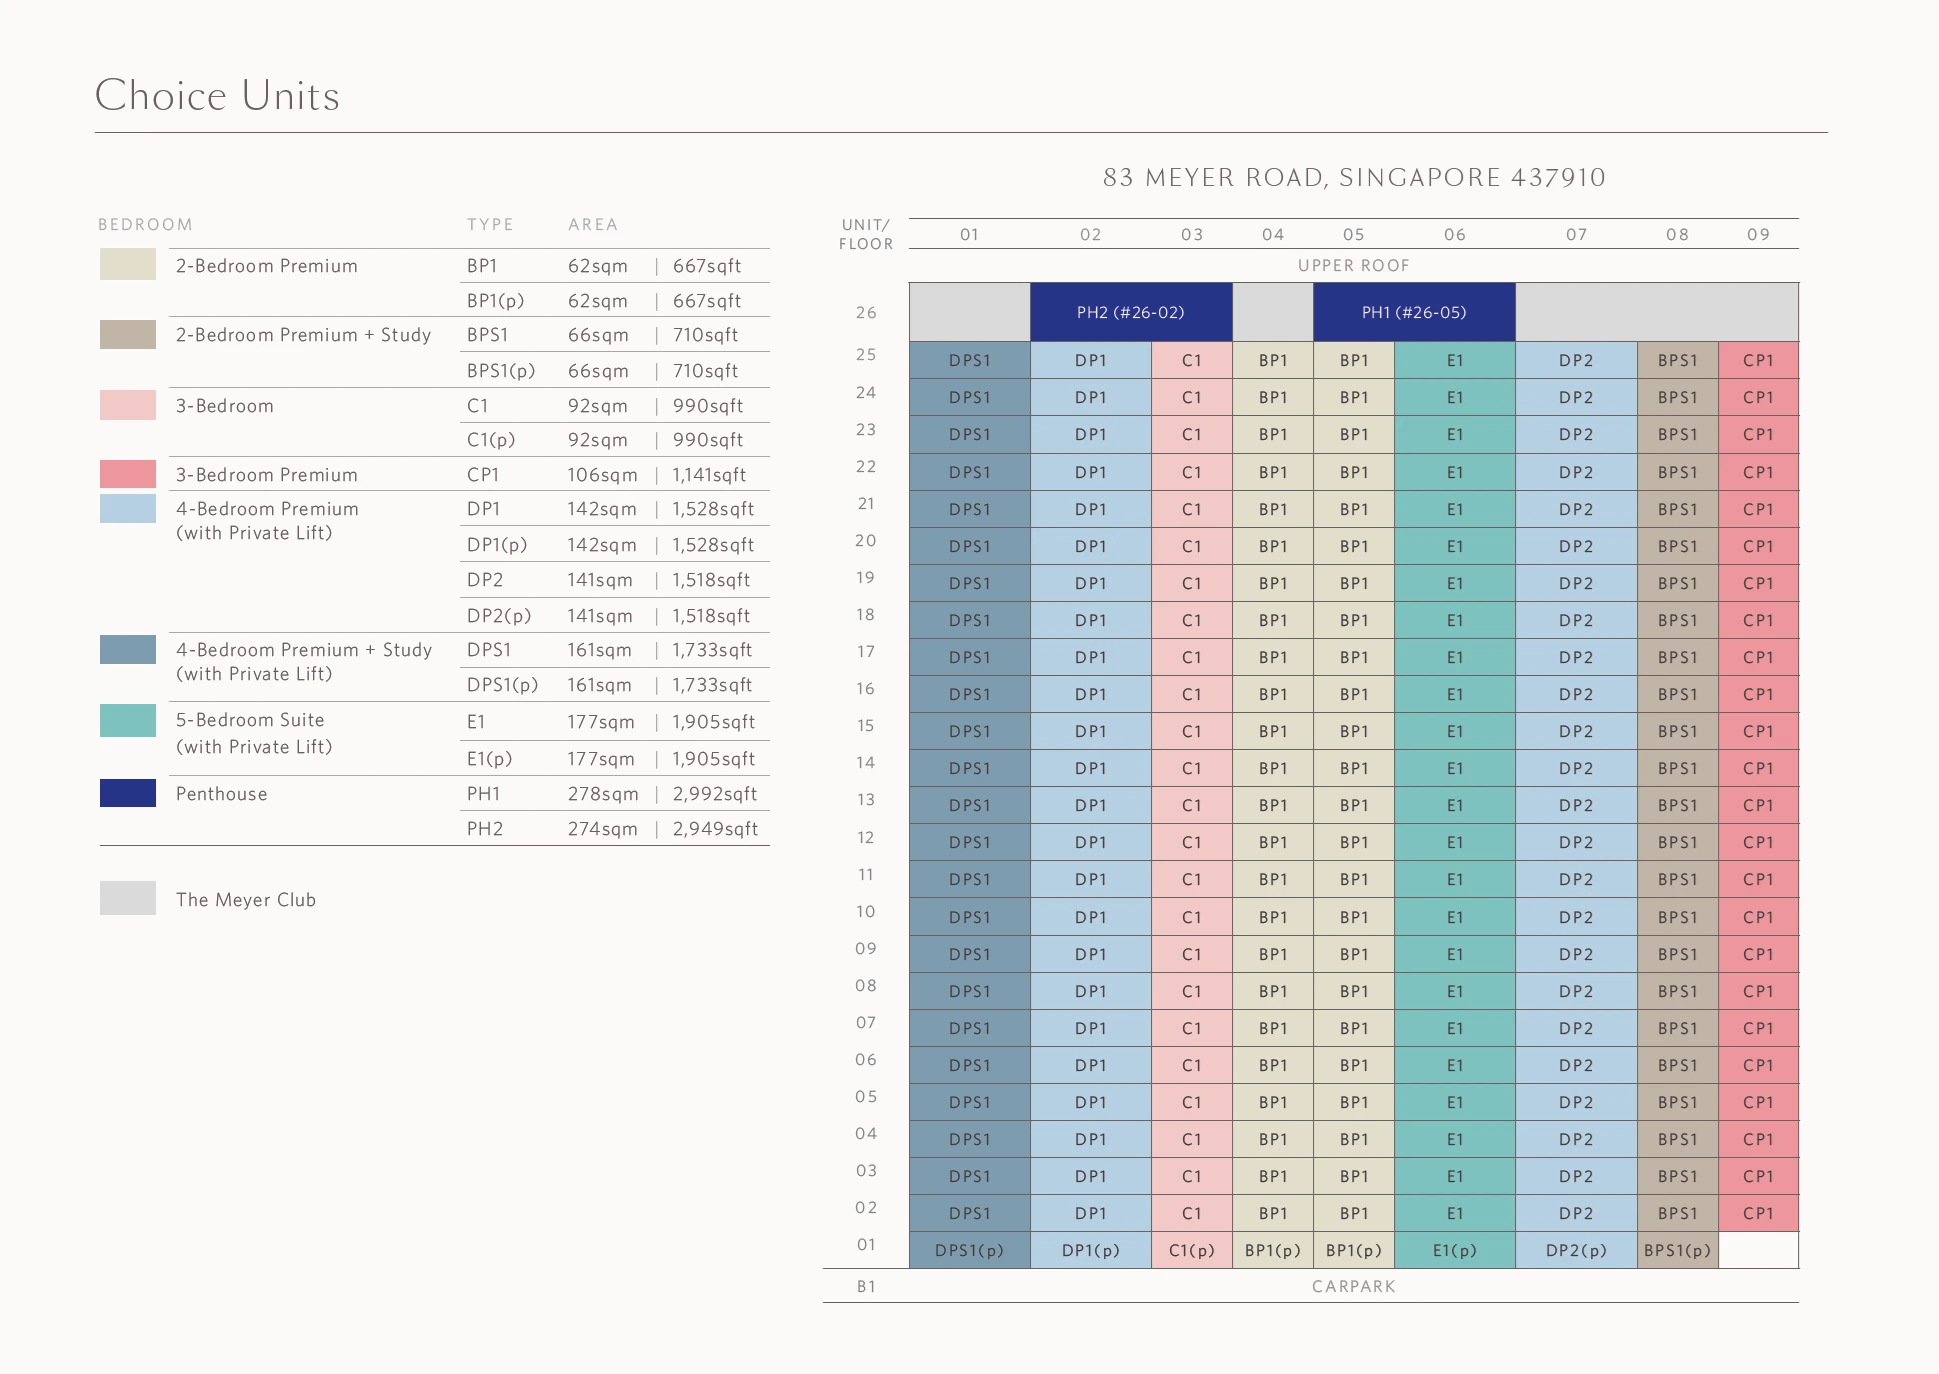
Elevation & stack plans
Floorplans
Select a plan to view it at full size.
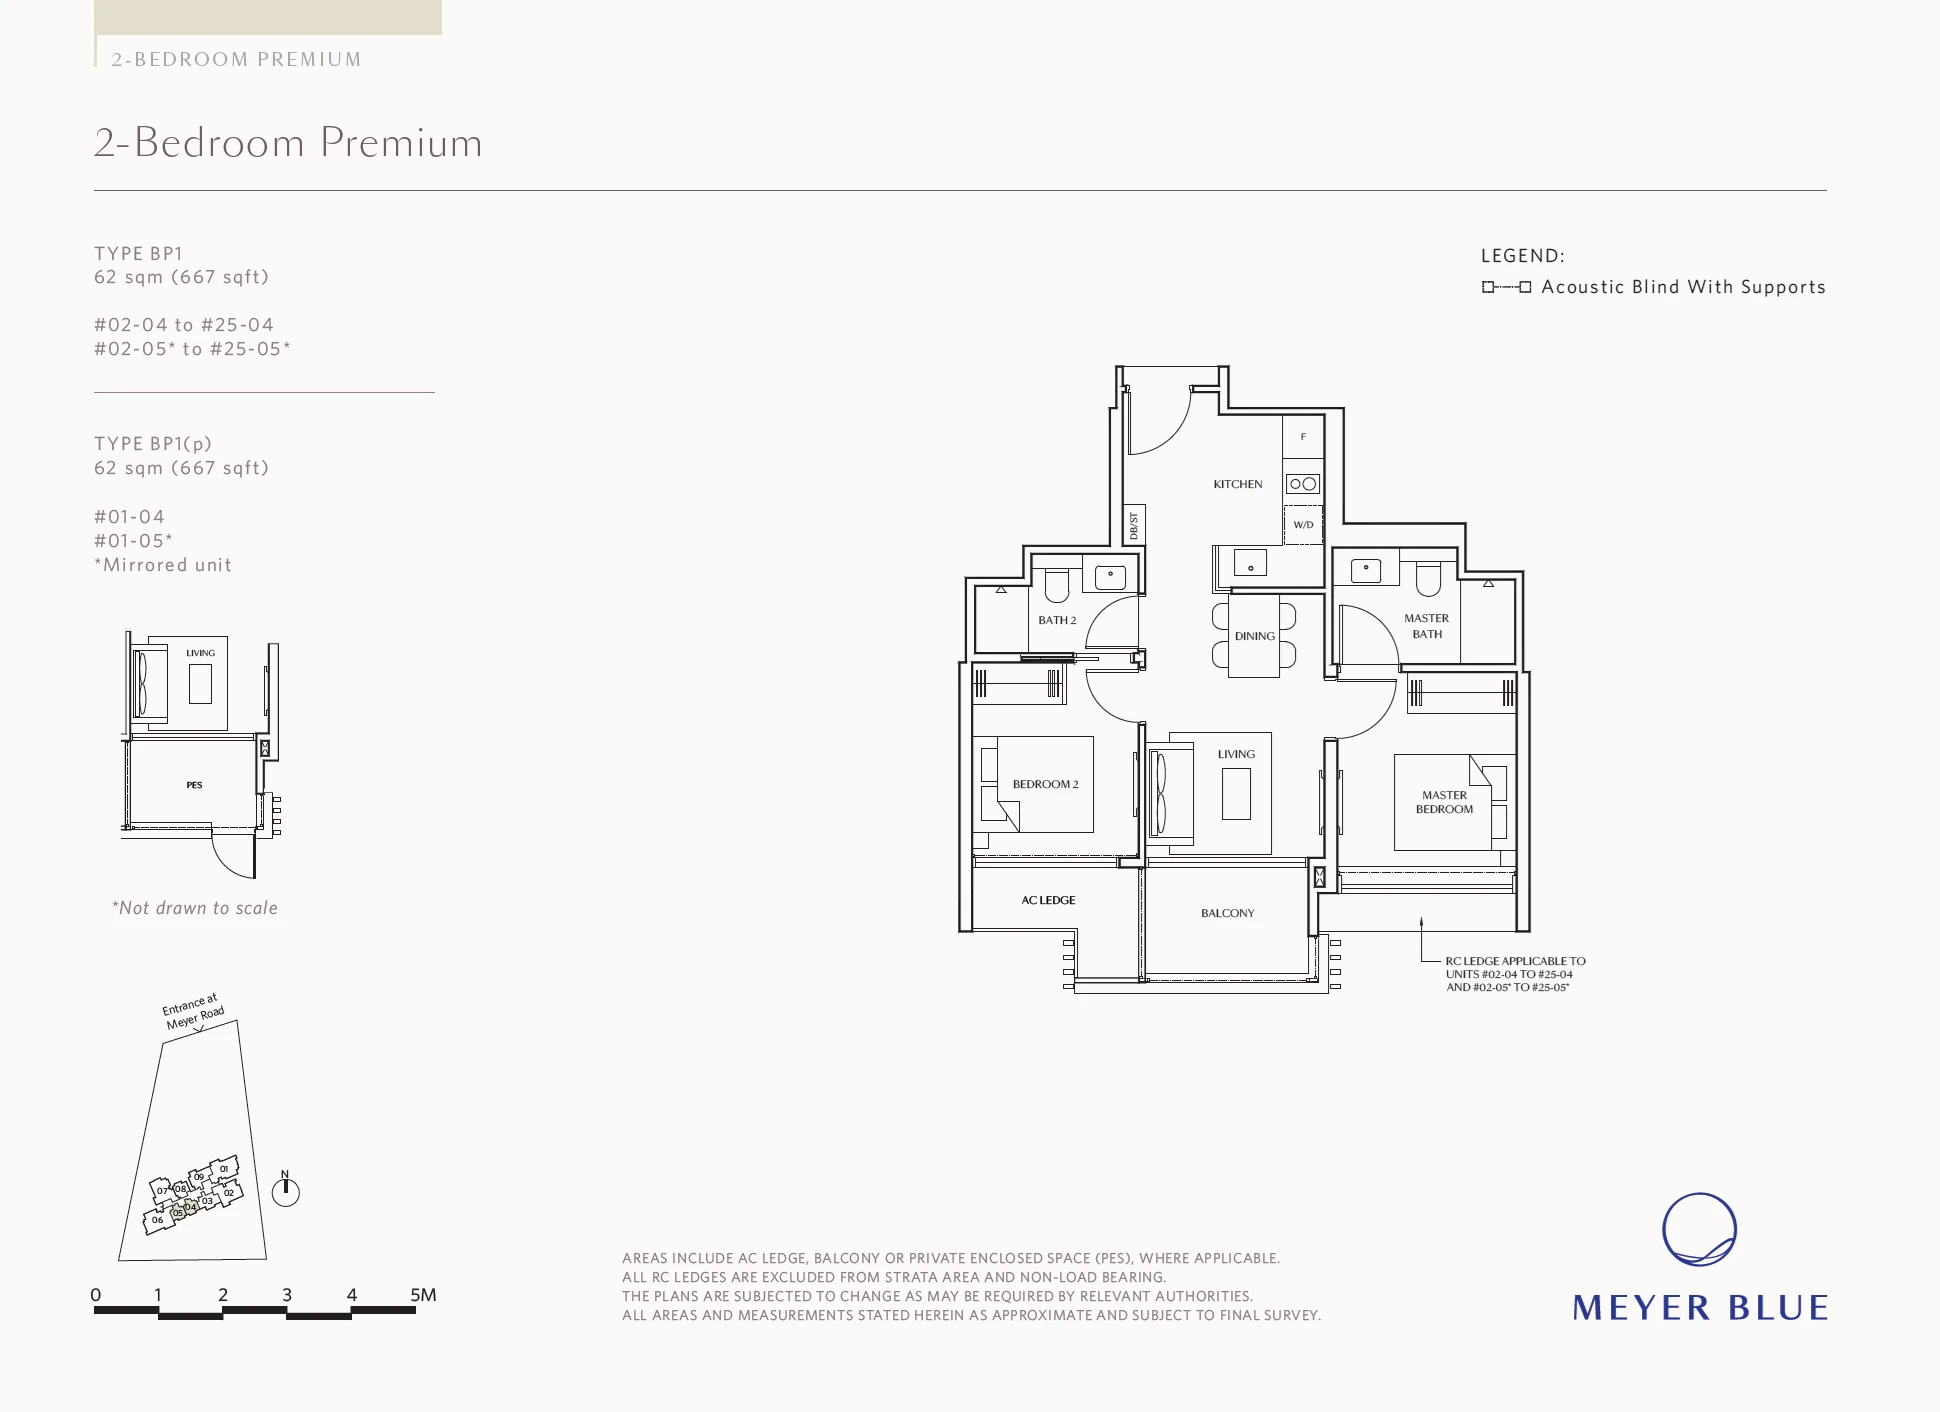

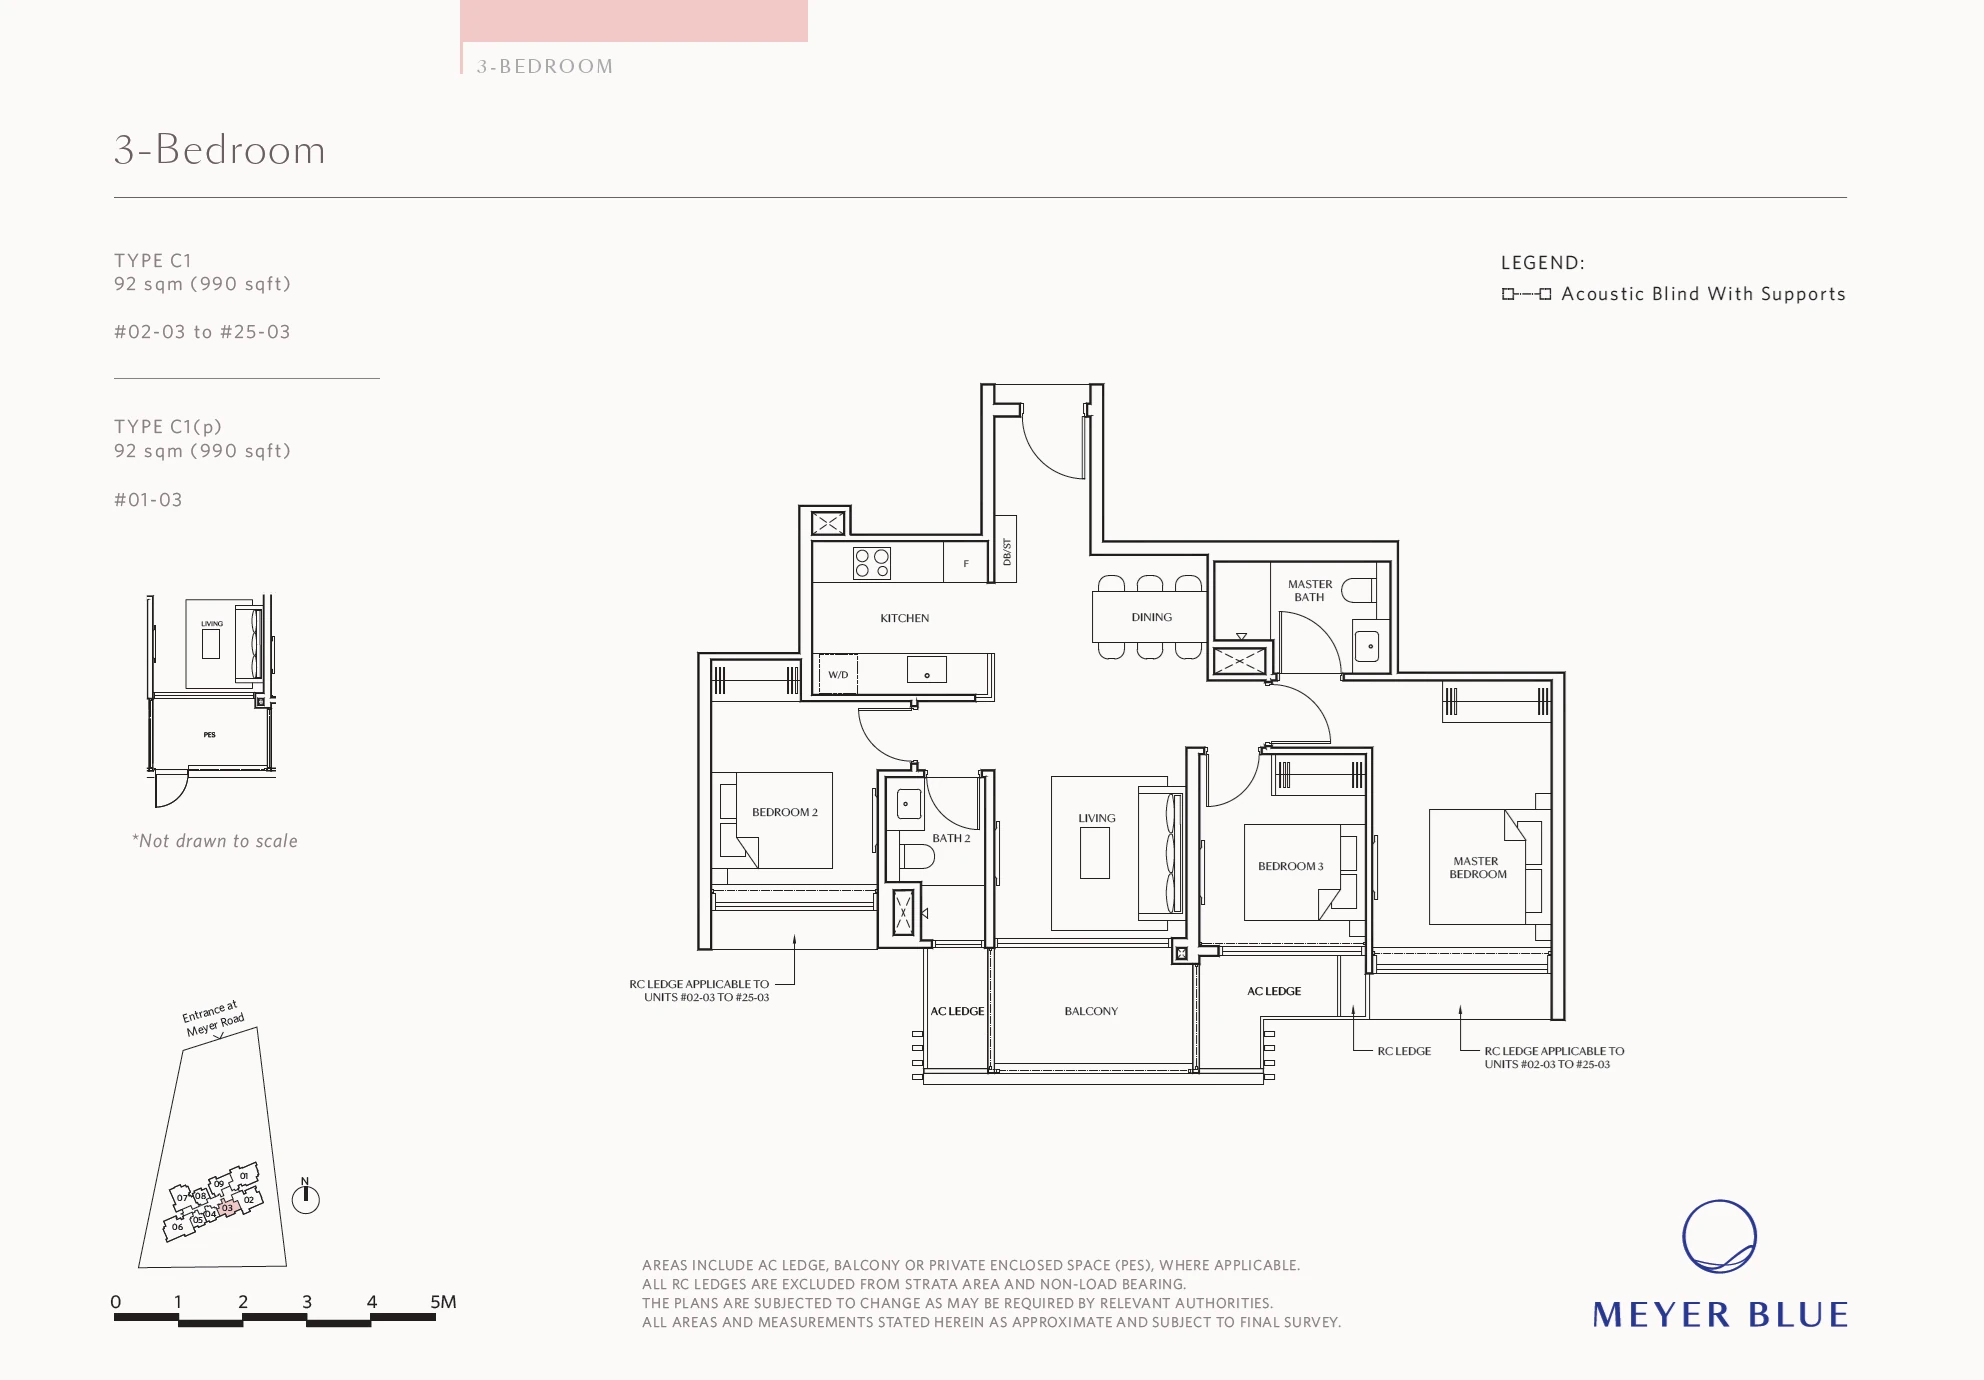
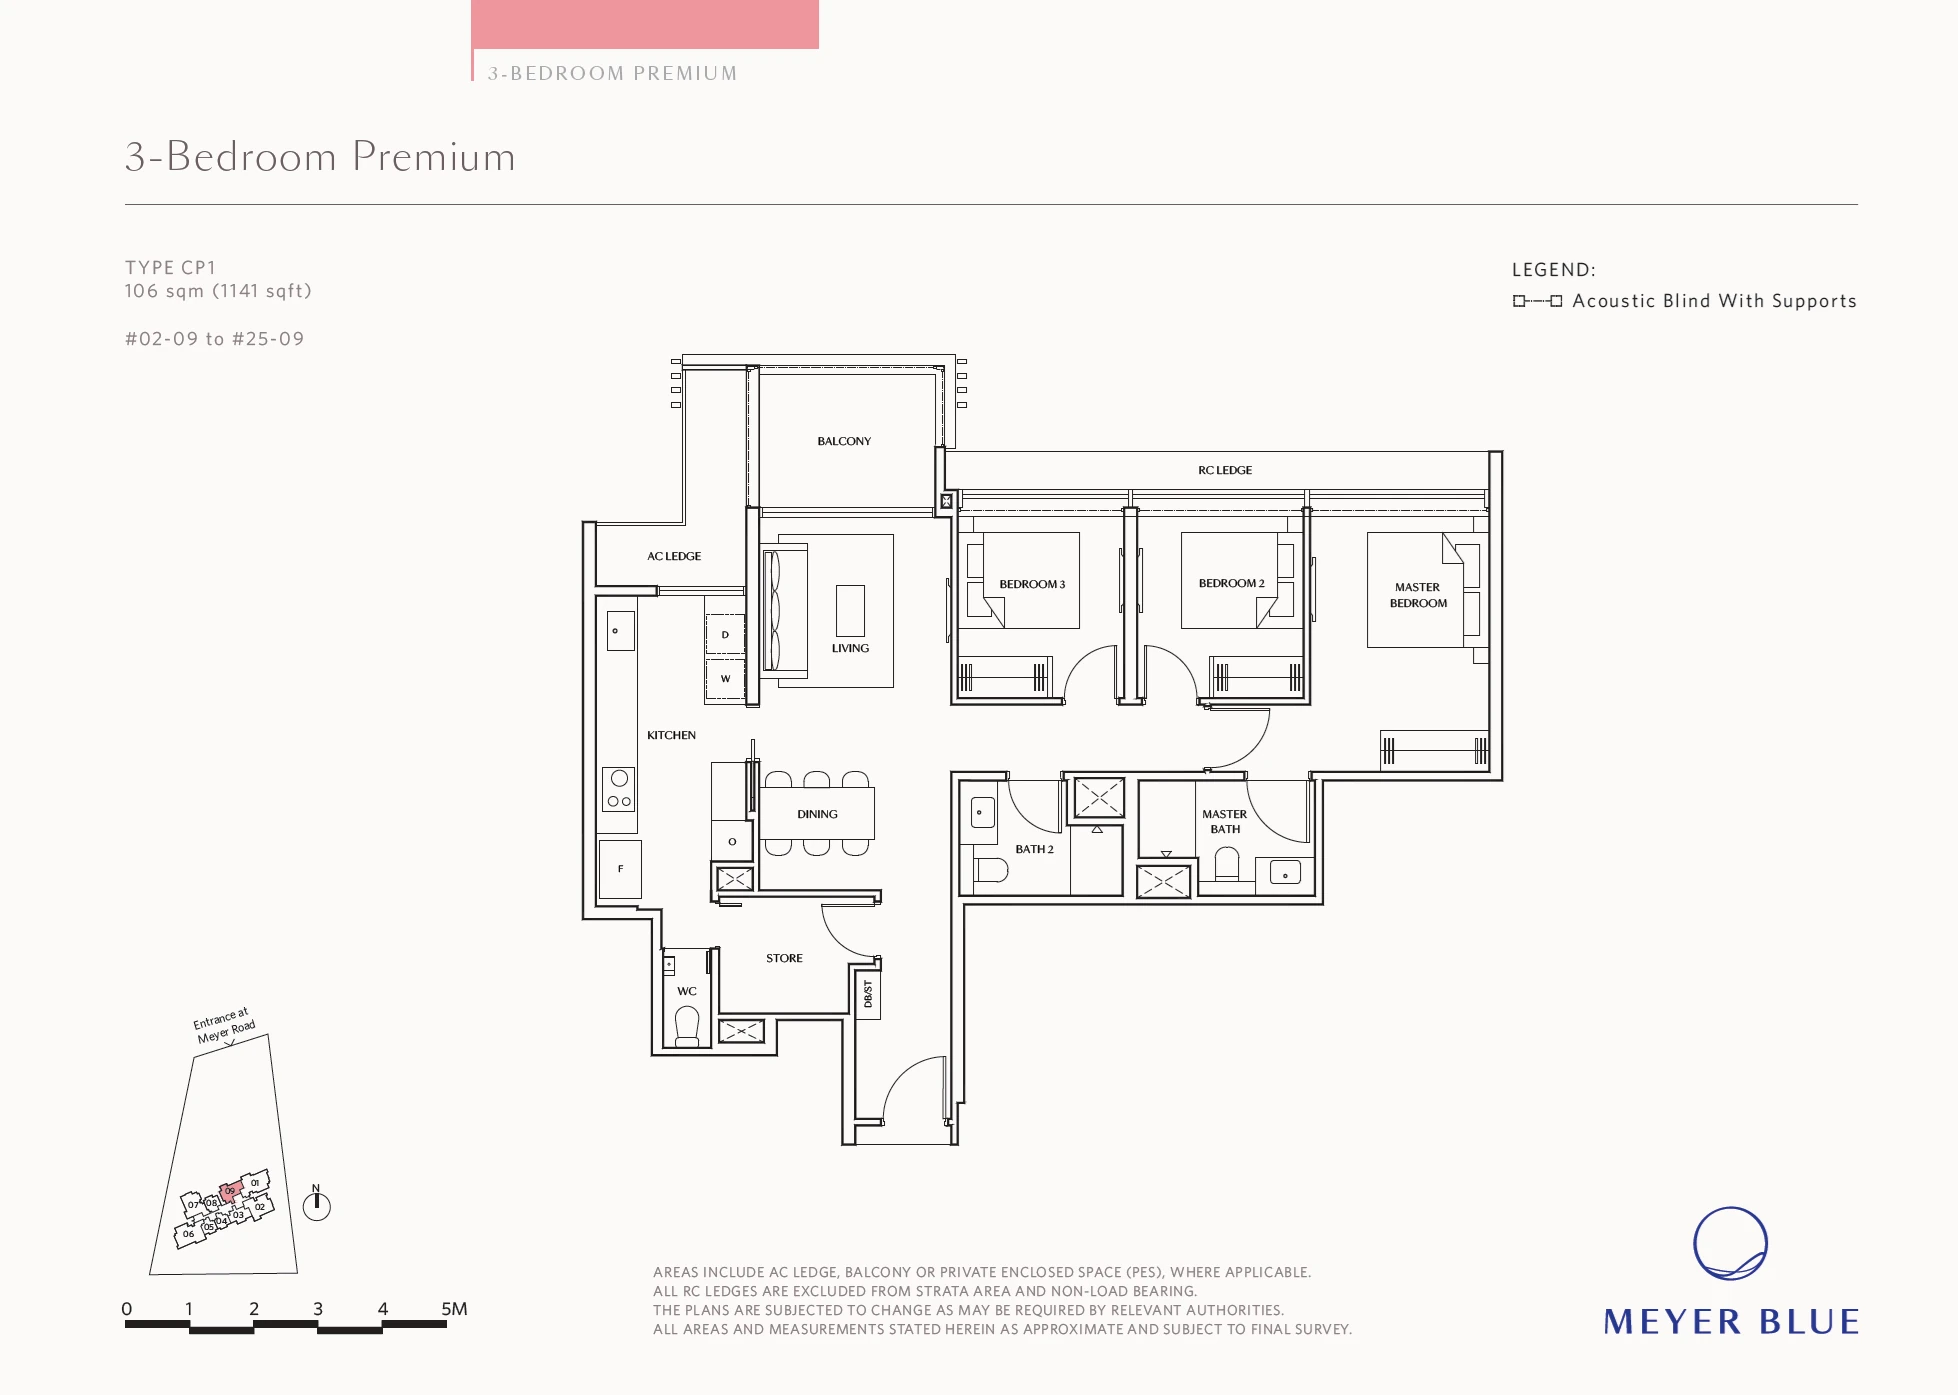
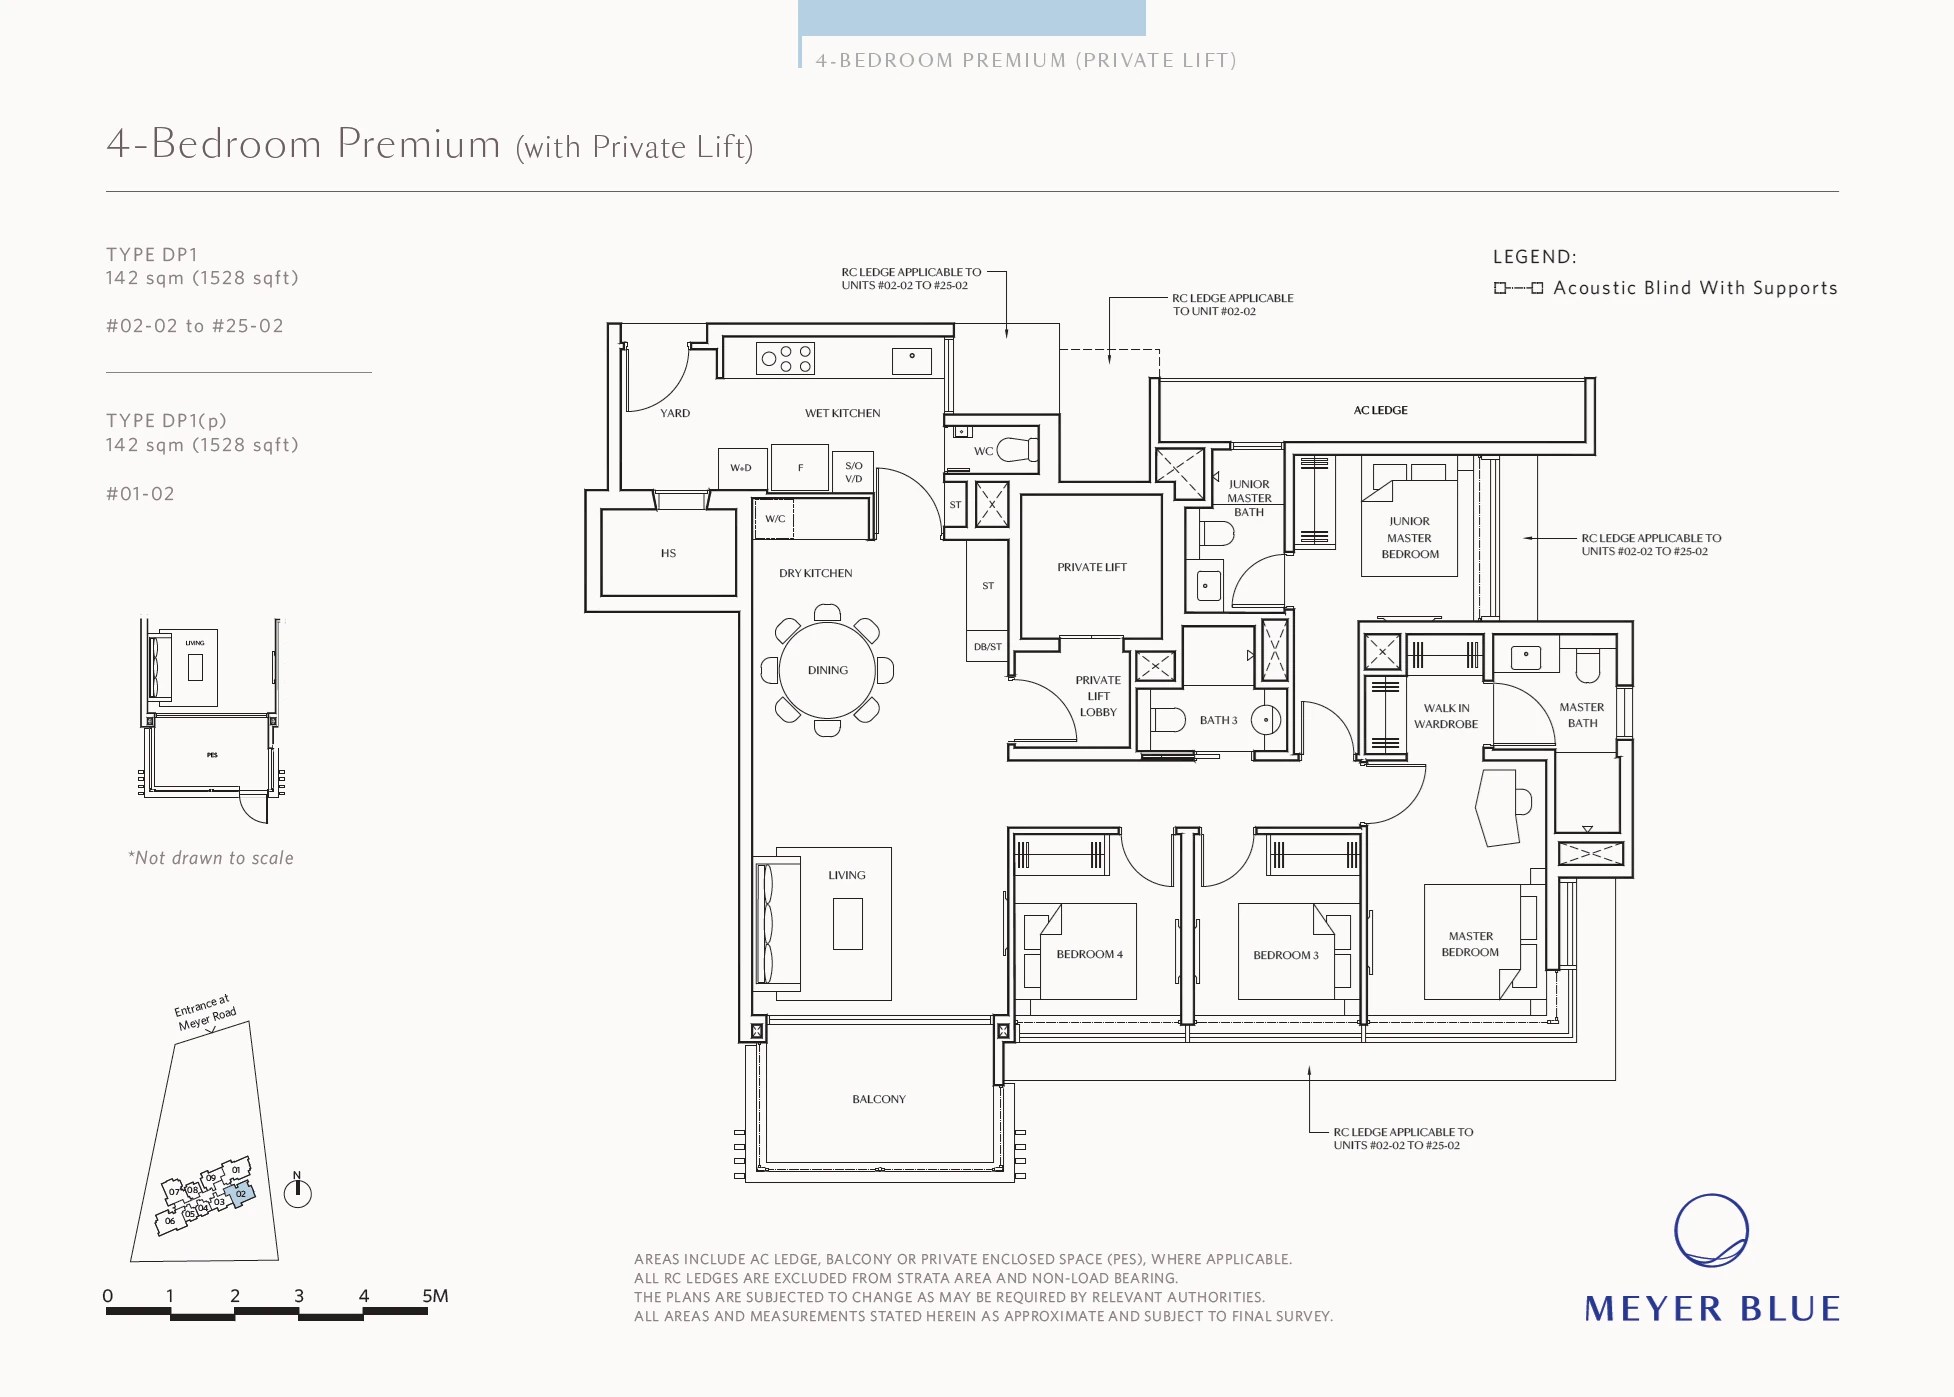
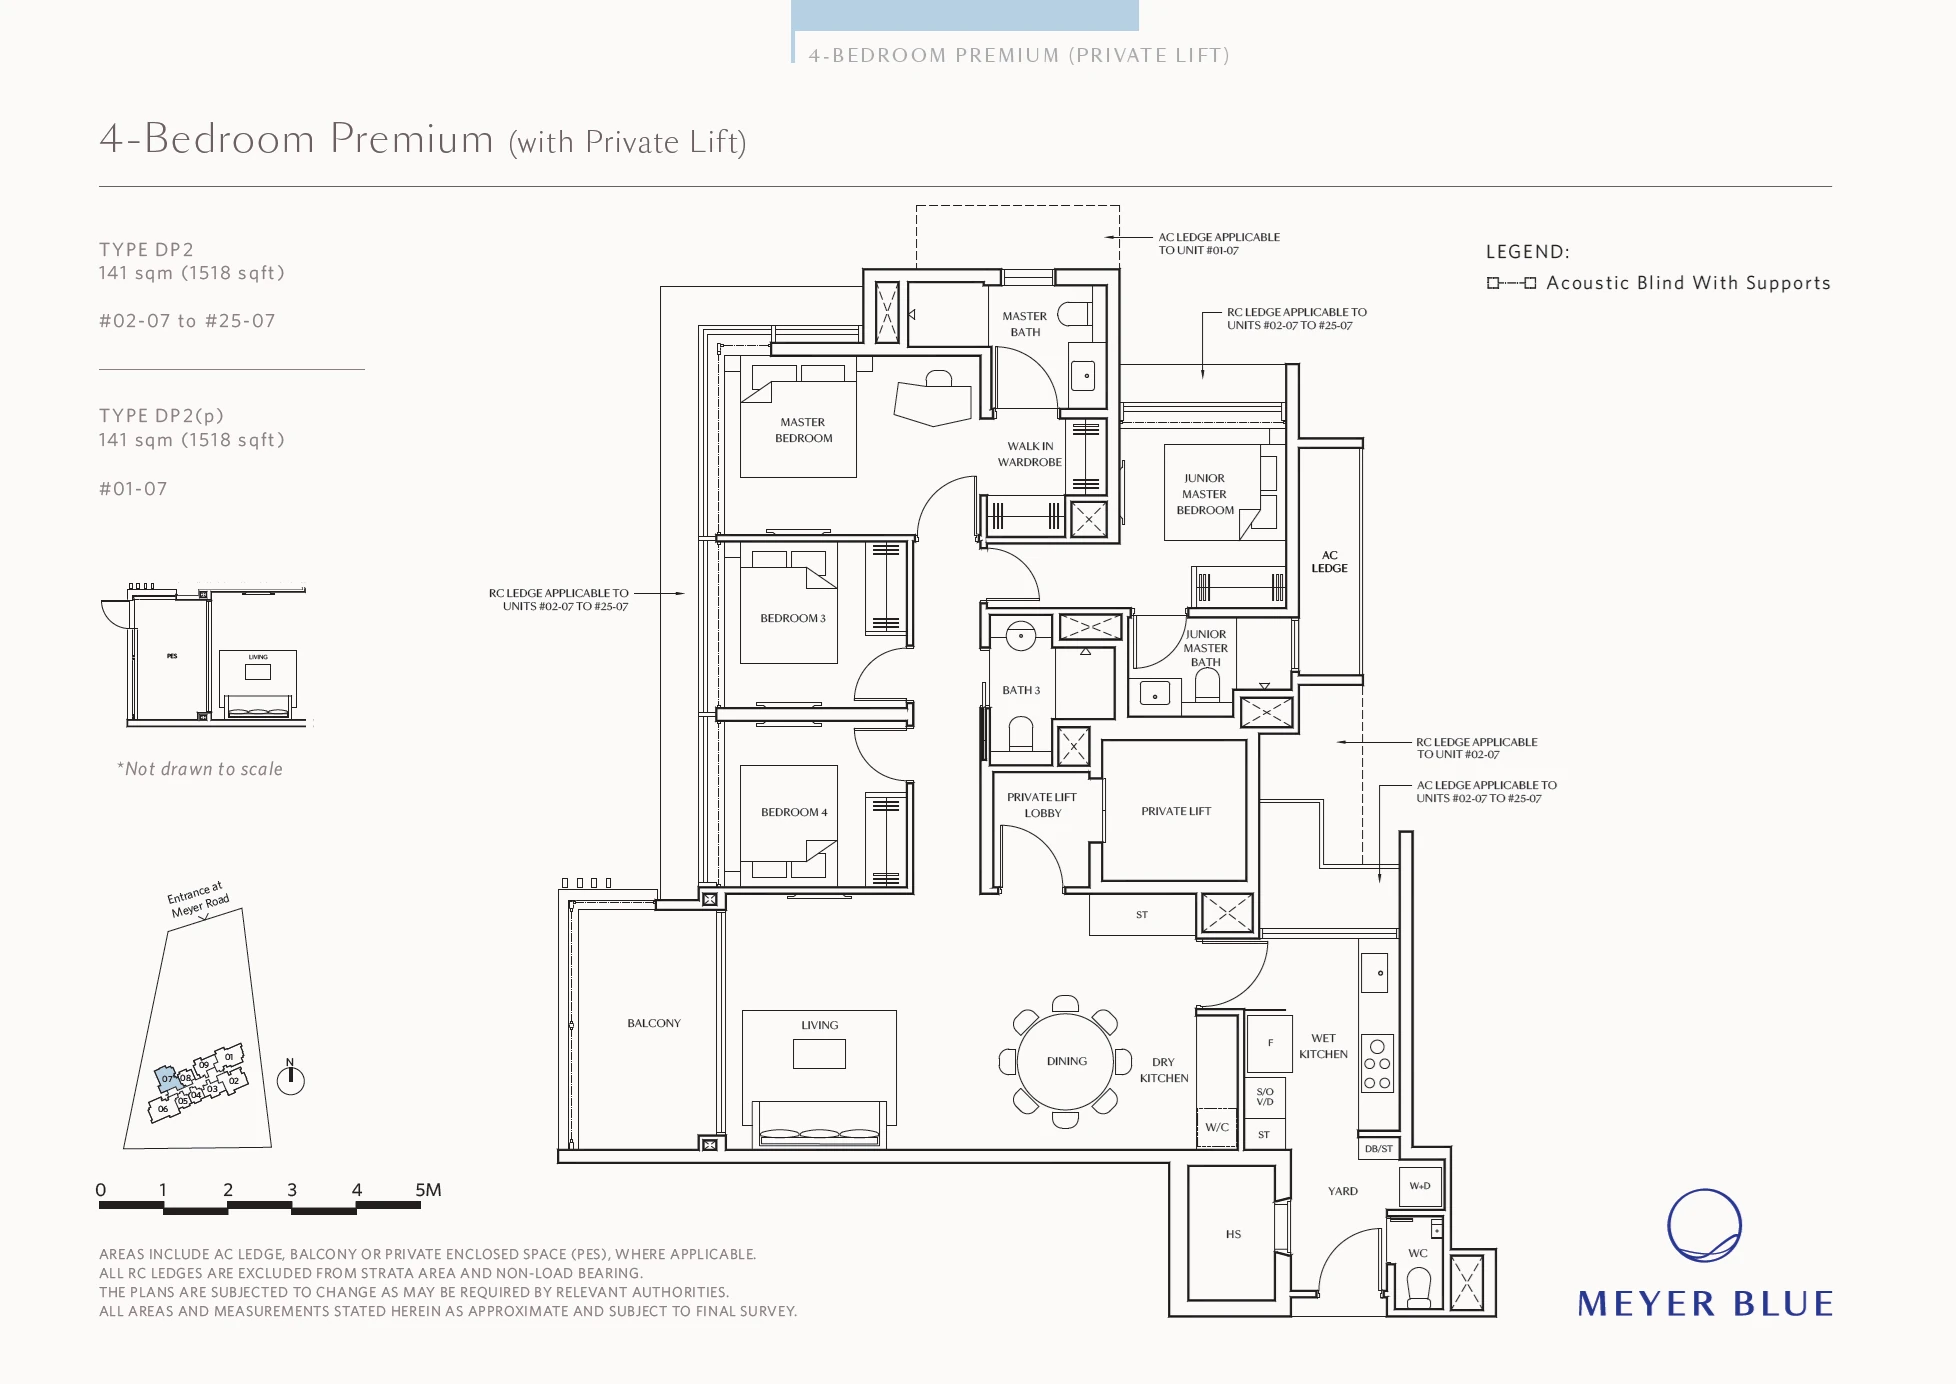
View all 10 floorplan sheets
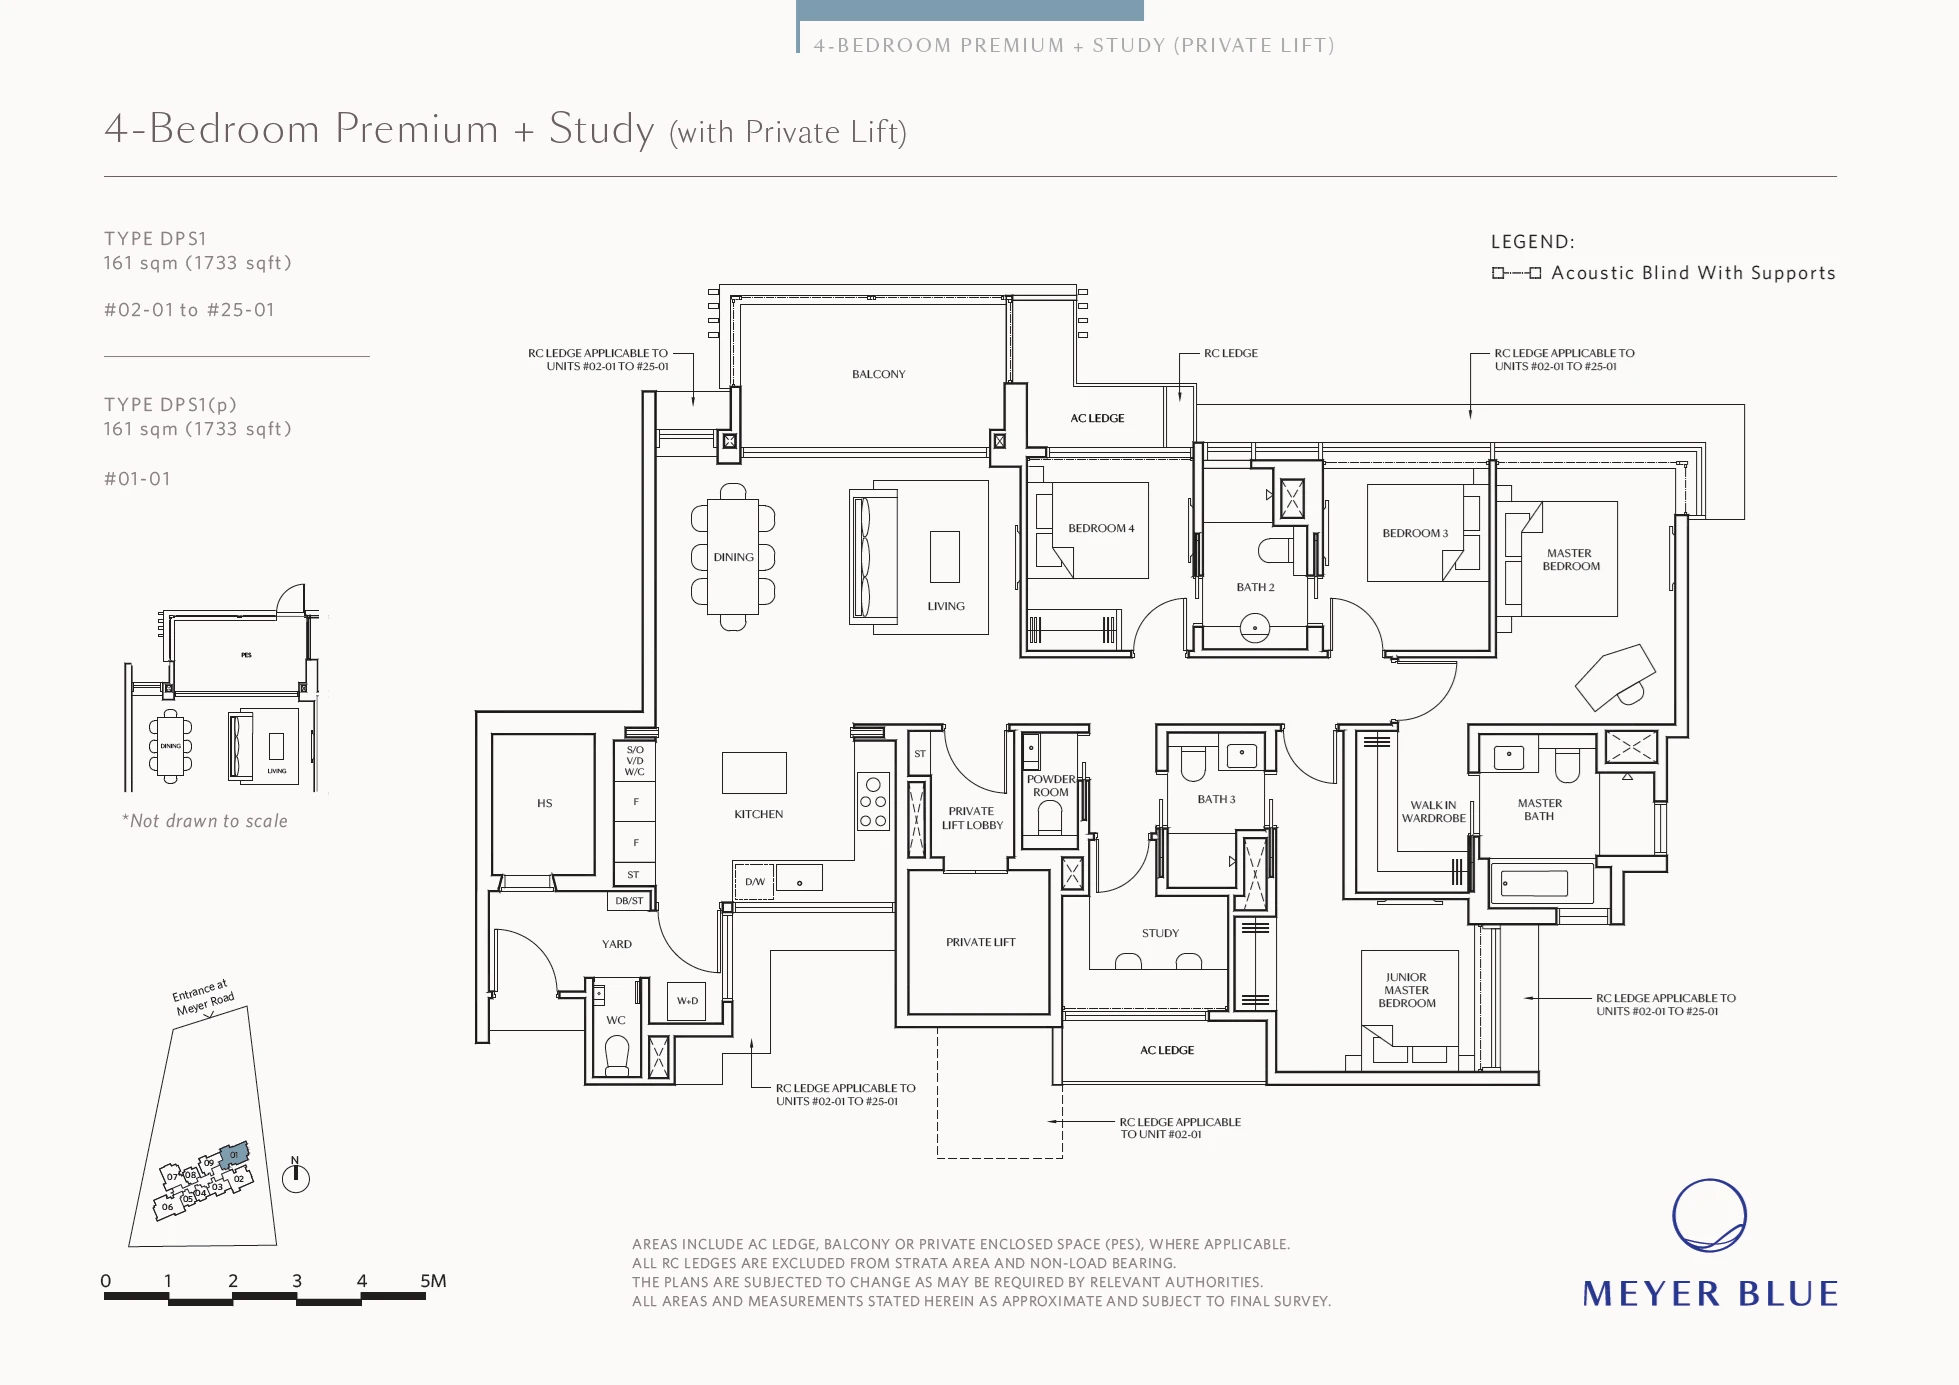
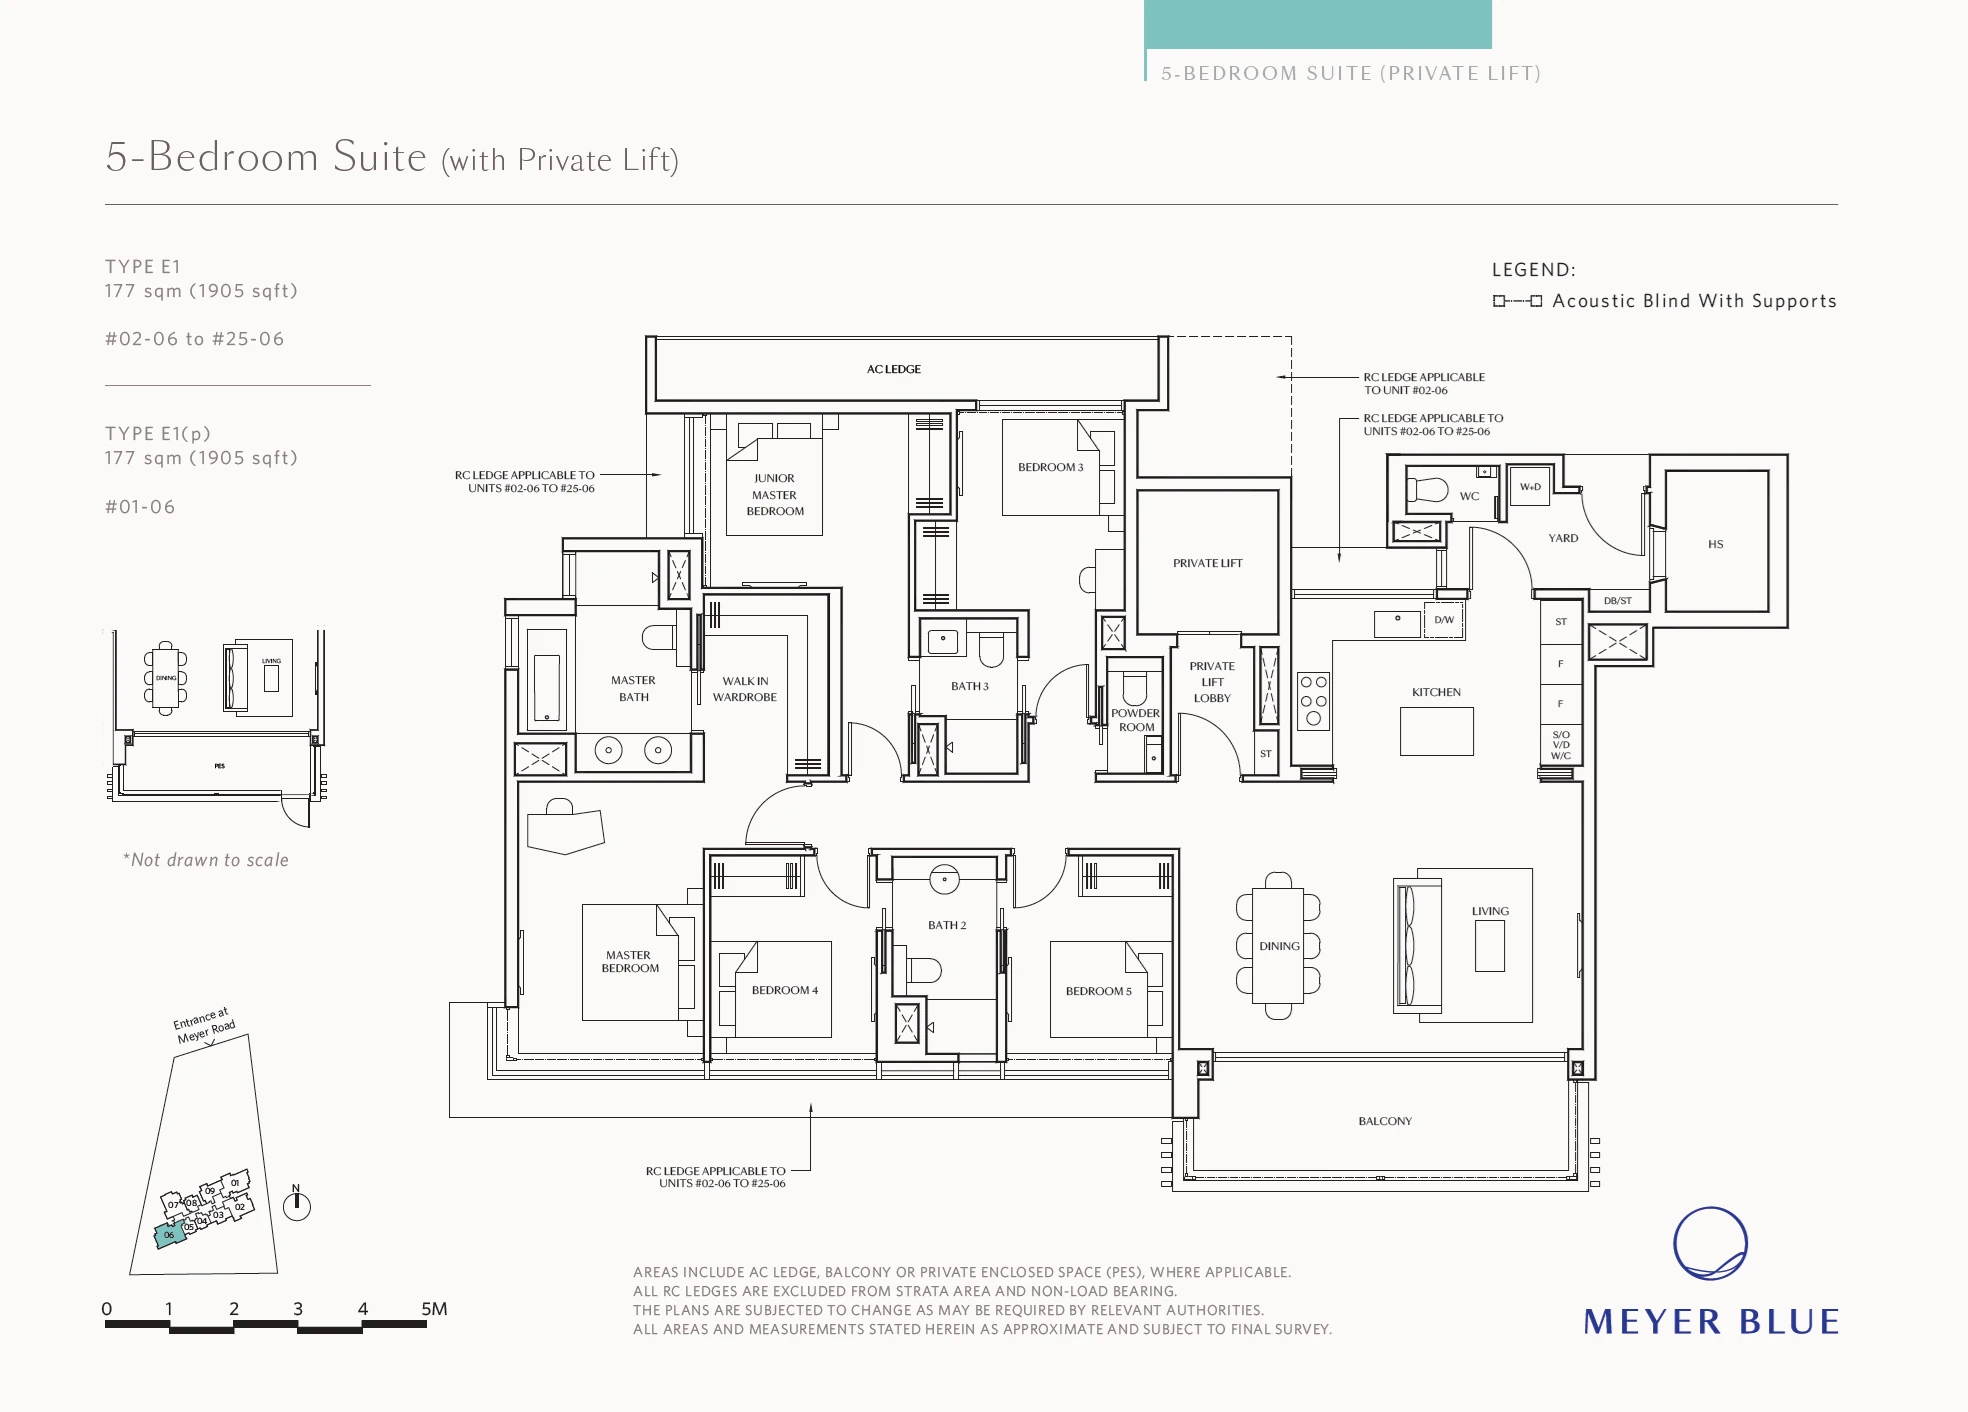
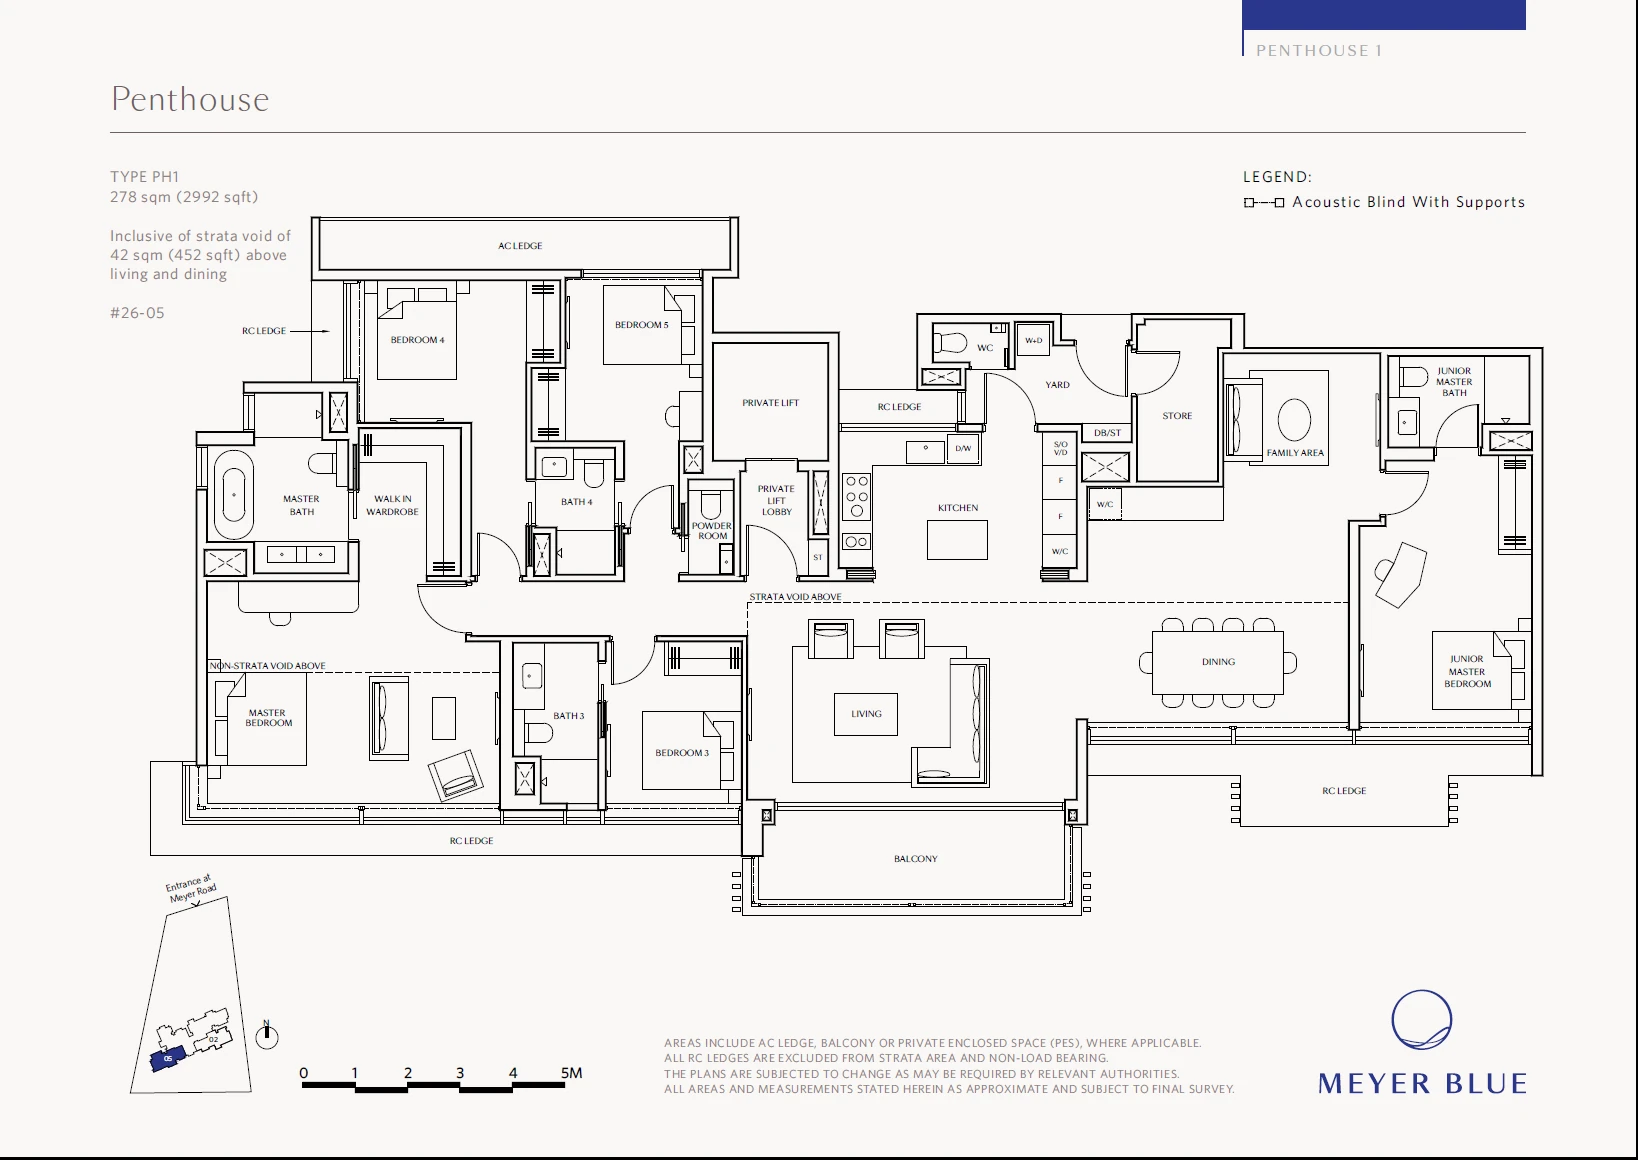
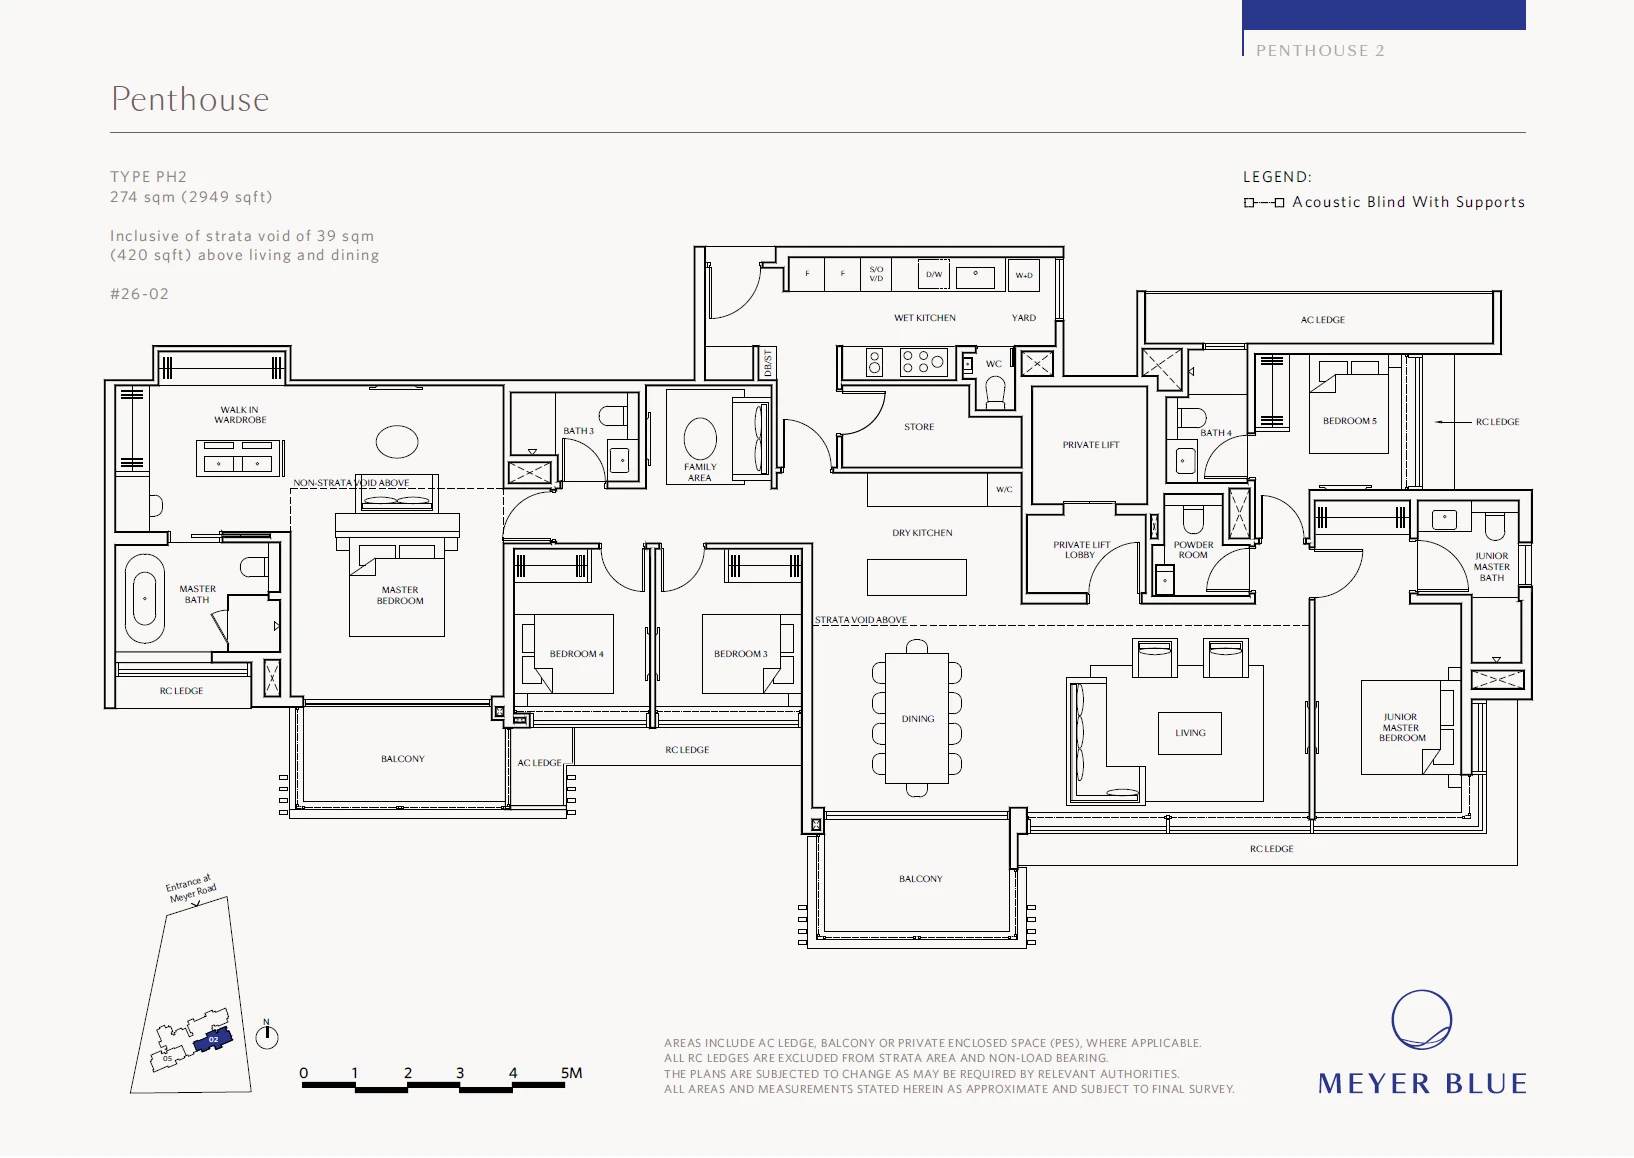
Plans are illustrative. Refer to the developer’s sale documents for dimensions and specifications.
Layout sizes
Browse the home types and floor areas. Availability is listed separately under units and prices.
| Type | Bedrooms | Size (sq ft) | Category |
|---|---|---|---|
| BP1 | 2 | 667 | Residential |
| BP1(p) | 2 | 667 | Residential |
| BPS1 | 2 | 710 | Residential |
| BPS1(p) | 2 | 710 | Residential |
| C1 | 3 | 990 | Residential |
| C1(p) | 3 | 990 | Residential |
| CP1 | 3 | 1,141 | Residential |
| DP1 | 4 | 1,528 | Residential |
| DP1(p) | 4 | 1,528 | Residential |
| DP2 | 4 | 1,518 | Residential |
| DP2(p) | 4 | 1,518 | Residential |
| DPS1 | 4 | 1,733 | Residential |
| DPS1(p) | 4 | 1,733 | Residential |
| E1 | 5 | 1,905 | Residential |
| E1(p) | 5 | 1,905 | Residential |
| PH1 | 5 | 2,992 | Residential |
| PH2 | 5 | 2,949 | Residential |
Areas may include balconies, terraces or other spaces. Refer to the developer’s plans for the exact layout and area definitions.
Recorded property transactions
Rental rates and contracts
Explore completed transactions alongside the launch asking prices and availability above.
Rental rates by home type
No matched rental contracts are available for this property in this dataset.
Monthly rental price per square foot is an interval calculated from the source area band. Open-ended or missing area bands do not produce an exact rental PSF. These completed contracts are separate from advertised asking rents.
Recorded transactions: URA property data.
Sun & shadows
FindSpace Property Fundamentals
Score evidence: 60% covered
32.06 known points. An overall grade needs evidence for every factor; missing points are not redistributed.
| Factor | Points | Basis |
|---|---|---|
| Relative price | — / 20 | Needs at least five recent property sales and five eligible peer properties; this cohort has 10 property sales and 2 eligible peers. National peer group: location differences affect prices. PSF uses source-recorded area, not a harmonised common measurement regime; included spaces and area rules may differ. |
| Recorded-price trend | 0.00 / 15 | Change in consecutive annual cohort median PSF. The mix of properties sold can change; this is not a capital-appreciation forecast. National cohort trend; this is not a local neighbourhood trend. Changes in area measurement regimes can also affect recorded PSF. |
| Transaction activity | — / 20 | Needs five recent property sales and five eligible peers; this cohort has 10 property sales and 2 peers. National peer group: location differences affect prices. |
| Rail access | 13.73 / 20 | Closest eligible recorded rail point within 2 km: Katong Park. Straight-line distance from approximate source points, not a walking route. The source extract may not contain every nearby feature. |
| Everyday amenities | 3.33 / 10 | Mean distance to the closest recorded supermarket, healthcare and park points, each within 1.5 km. Historical source extract, not a complete national amenity inventory; straight-line distances are not walking routes. |
| Tenure | 15.00 / 15 | Freehold; tenure component receives the maximum score. |
The same factors, weights and grade bands apply across new launches, private resale, landed and HDB. Recorded evidence is not a valuation or forecast.
Open the research, cohort details and redevelopment evidence →